
Using Alteryx Designer
We have covered at a high level what the benefits of the Alteryx platform are. This section will look a bit closer at Alteryx Designer and why it is suitable for data engineering.
As mentioned previously, Designer is the desktop workflow creation tool in the Alteryx platform. You create the data pipelines and perform advanced analytics in Designer. Designer can also create preformatted reports, upload datasets to API endpoints, or load data into your database of choice.
Here, we will answer some of the questions that revolve around Designer:
- Why is Alteryx Designer suitable for data engineering
- How to start building a workflow in Designer
- How you can leverage the InDB tools for large databases
- And explain some workflow best practices
Answering the preceding questions will give you a basic understanding of why Designer is a good tool for building your data pipelines and the basis for the DataOps principles we will talk about later.
Why is Alteryx Designer suitable for data engineering?
Alteryx Designer utilizes a drag-and-drop interface for building a workflow. Each tool represents a specific transformation or process. This action and visibility of the process allow for a high development speed and emphasize an iterative workflow to get the best results. Throughout the workflow, you can check the impact of the tool's changes on the records and compare them to the tool's input records.
Building a workflow in Designer
If you open a new Designer workflow, you will see the following main interface components:
- Tool Pallet
- Configuration Page
- Workflow Canvas
- Results Window
These components are shown in the following screenshot:
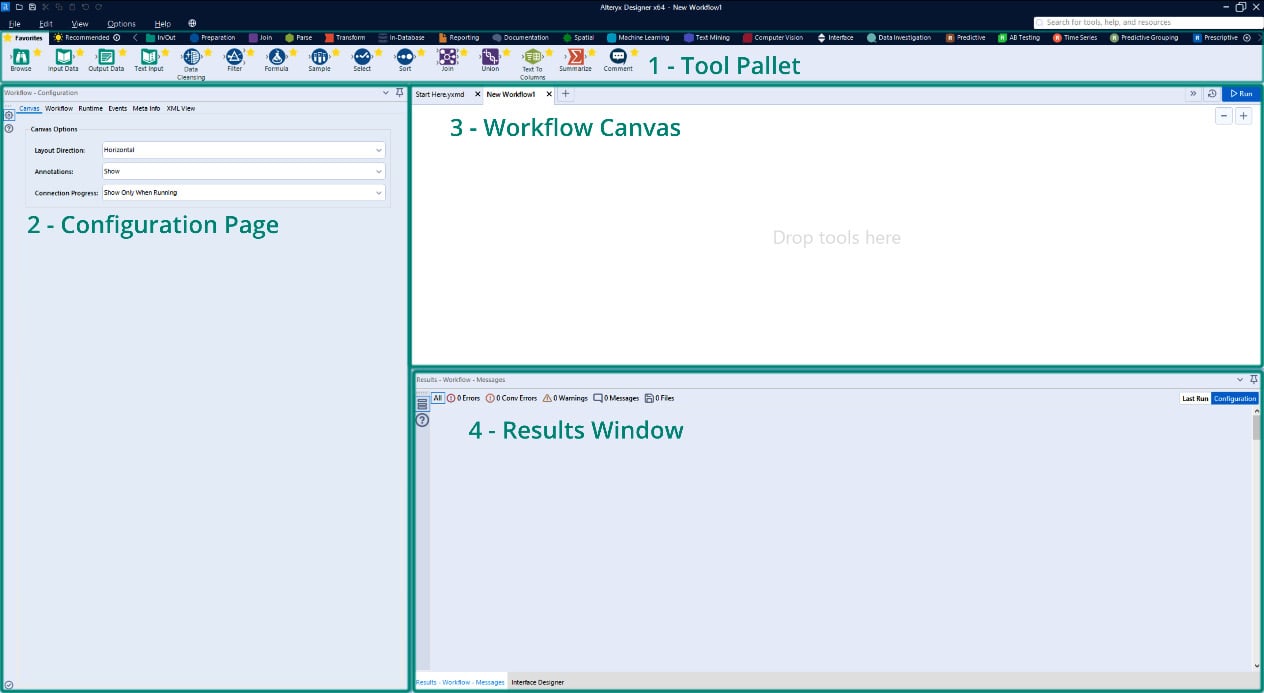
Figure 1.1 – Alteryx Designer interface
Each of these sections provides a different set of information to you while building a workflow.
The Canvas gives a visual representation of the progress of a workflow, the configuration page allows for quick reference and the changing of any settings, and the results window provides a preview of the changes made to the dataset.
This easy viewing of the entire pipeline in the canvas, the data changes at each transformation, and the speedy confirmation of settings in the workflow allow for rapid iteration and testing. As a data engineer, getting a dataset to the stakeholder accurately and quickly is the central goal of your efforts. These Designer features are focused on making that possible.
The default orientation for a workflow is left to right, but you can also customize this to work from top to bottom. Throughout this book, I will describe everything in this context, but be aware that you can change it.
Accessing Online Help
When working in the Designer interface, you can access the online help by pushing the F1 button on your keyboard. Additionally, if you have a particular tool selected when you push the F1 button, you will navigate to the help menu for that specific tool.
Let's build a simple workflow using the tools in the Favorites tool bin. We will complete the following steps and create the completed workflow shown in Figure 1.2:
- Connect to a dataset.
- Perform a calculation.
- Summarize the results.
- Write the results to an Alteryx
yxdbfile:
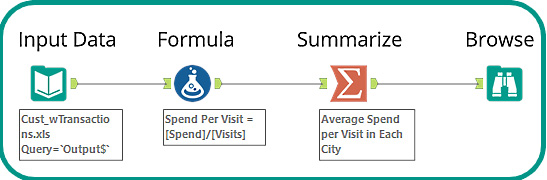
Figure 1.2 – Introduction workflow
You can look at the example workflow in the book's GitHub repository here: https://github.com/PacktPublishing/Data-Engineering-with-Alteryx/tree/main/Chapter%2001.
Using an Input Data tool, we can connect to the Cust_wTransactions.xls dataset. This dataset is one of the Alteryx Sample datasets, and you can find this in the Alteryx Program folder, located at C:\ProgramFiles\Alteryx\Samples\data\SampleData\Cust_wTransactions.xls.
In step 2 of the process, we create a field with the following steps:
- Create a new field with a Formula tool: When creating a formula, you always go through the following steps: Create a new Output Column (or select an existing column).
- Set the data type: Set the data type for a new column (you cannot change an existing column's data type).
- Write the formula: Alteryx has field and formula autocompletion, so that will also help for speeding up your development.
The workflow of the preceding steps can be seen in the following screenshot:
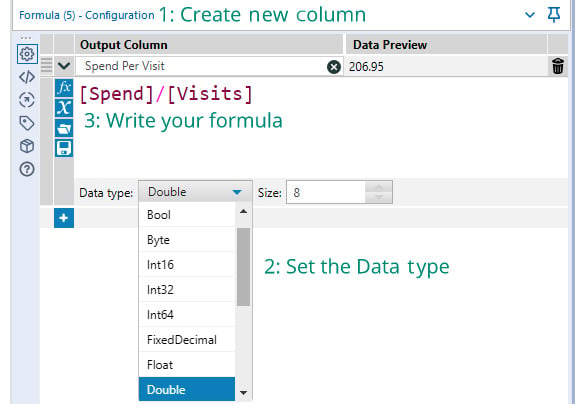
Figure 1.3 – Steps for creating a formula
The third step in the process is to summarize the results to find the average speed per customer in each city as follows:
- Choose any grouping fields: Select any fields that we are grouping by, such as
City, and then add the action ofGroup Byfor that field. - Choose any aggregation fields: Select the field that we want to aggregate,
Spend Per Visit, and apply the aggregation we want to action (Numeric action menu | Average option)
The configuration for the summary described is shown in the following screenshot:
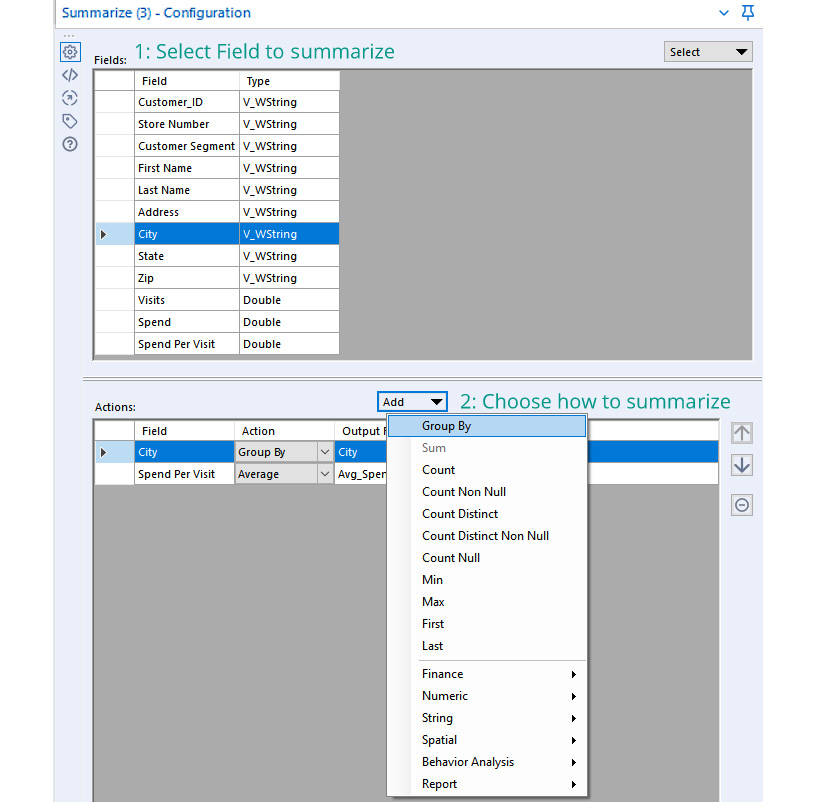
Figure 1.4 – Summarize configuration
The final step in our workflow is to view the results of the processing. We can use the Browse tool to view all the records in a dataset and see the full results.
The process we have looked at works well on smaller datasets or data in local files. It is less effective when working with large data sources or when the data is already in a database. In those situations, using InDB tools is a better toolset to use. We will get an understanding of how to use those tools in the next section.
What can the InDB tools do?
The InDB tools are a great way to process datasets without copying the data across the network to your local machine. In the following screenshot, we have an example workflow that uses a sample Snowflake database to process 4.1 GB of data in less than 2 minutes:
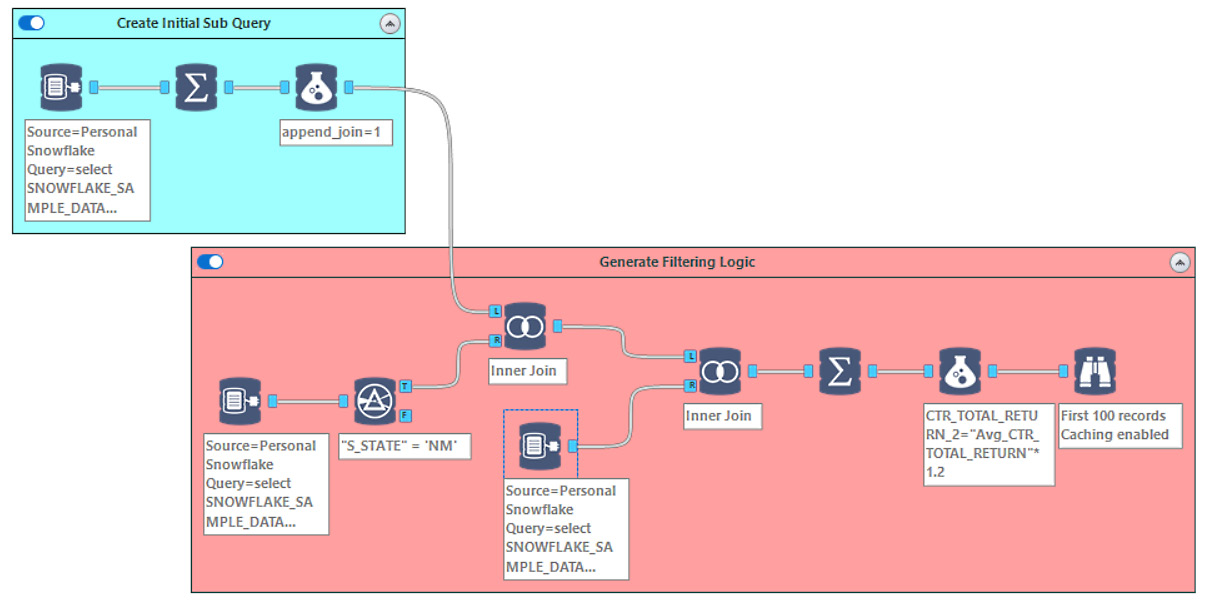
Figure 1.5 – Example workflow using InDB tools
You can look at the example workflow in the book's GitHub repository here: https://github.com/PacktPublishing/Data-Engineering-with-Alteryx/tree/main/Chapter%2001.
This workflow entails three steps:
- Generate an initial query for the target data.
- Produce a subquery off that data to generate the filtering logic.
- Apply the filtering logic to the primary query.
When looking at the visual layout, we see the generation of the query, where the logic branches off, and how we merge the logic back onto the dataset. The automated annotations all provide information about what is happening at each step. At the same time, the tool containers group the individual logic steps together.
We will look at how to use the InDB tools in more detail in later chapters, but this workflow shows how complicated queries are run on large datasets while still providing good performance in your workflow.
Building better documentation into your workflow improves the usability of the workflow. Therefore, adding this documentation is considered the best practice to employ when developing a workflow. We will explore how we can apply the documentation in the next section.
Best practices for Designer workflows
Applying Designer best practices makes your data engineering more usable for you and other team members. Having the documentation and best practices implemented throughout a workflow embeds the knowledge of what the workflow components are doing in context. It means that additional team members, or you in the future, will be able to open a workflow and understand what each small section is trying to achieve.
The best practices fall into three areas:
- Supplementing the automatic annotations: The automatic annotations that Alteryx creates for individual tools provide basic information about what has happened in a tool. The annotations do not offer an explanation or justification of the logic. Additionally, the default naming of each tool doesn't provide any context for the log outputs. We can add more information in both of these areas. We can update the tool name to describe what is happening in that tool and expand the annotation to include more detail.
- Using tool containers to group logic: Adding tool containers to a workflow is a simple way of visually grouping processes on the canvas. You can also use specific colors for the containers to highlight different functions. For example, you can color input functions green and logic calculations in orange. These particular color examples don't matter as long as the colors are consistent across workflows and your organization.
- Adding comment and explorer box tools for external context: Often, you will need to add more context to a workflow, and this context won't fit in an annotation or color grouping. You can supplement the automatic documentation with Comment tools for text-based notes or an explorer box to reference external sources. Those external sources could be web pages, local HTML files, or folder directories. For example, you can include web documentation or a README file in the workflow, thereby providing deeper context.
These three areas all focus on making a workflow decipherable at a glance and quickly understandable. They give new data engineers the information they need to understand the workflow when adopting or reviewing a project.
With a completed workflow, the next step will be making the workflow run automatically. We also need to make the datasets that the workflow creates searchable and the lineage traceable. We will use Alteryx Server and Alteryx Connect to achieve this, which we will look at next.