
An overview of the Power Query editor
We will use our sales data case study to understand the various components of the Power Query editor.
The files we are going to use are in a folder that can be accessed using this link: https://tinyurl.com/DMEFINEX
Use this link to download a zipped file that contains one folder and five Excel worksheets as shown here:
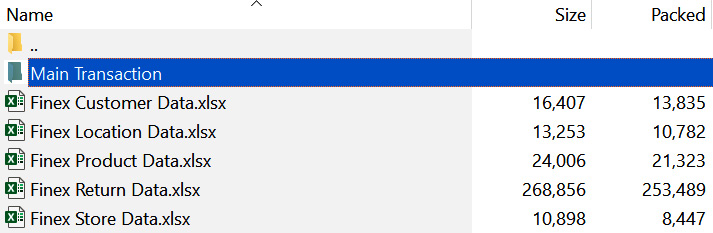
Figure 3.3 – The list of files in a zipped file
Extract the files to get access to the files.
When you open the folder, you should see a folder named Main Transaction that contains six files. These files are sales records from 2015 to 2020 for our sales organization, Finex Ventures.
There are five other files outside the folder, which contain information on the following:
- Customers
- Locations
- Products
- Stores
- Product returns
As we covered in an earlier chapter, this is normalized data. This data structure separates the main activities of the business from...