

Adding tables and charts to dashboards
We will start with a basic dashboard panel containing a table we created in Chapter 6, Creating Tables and Charts Using SPL. As a review, let’s complete the following steps:
- Run the following query in the search bar:
index=botsv1 earliest=0 sourcetype=iis
| table _time, c_ip, s_ip, s_port, cs_uri_stem, cs_Referer, sc_status
This query displays IIS logs in the form of a table. Figure 7.1 shows the result of running this query:
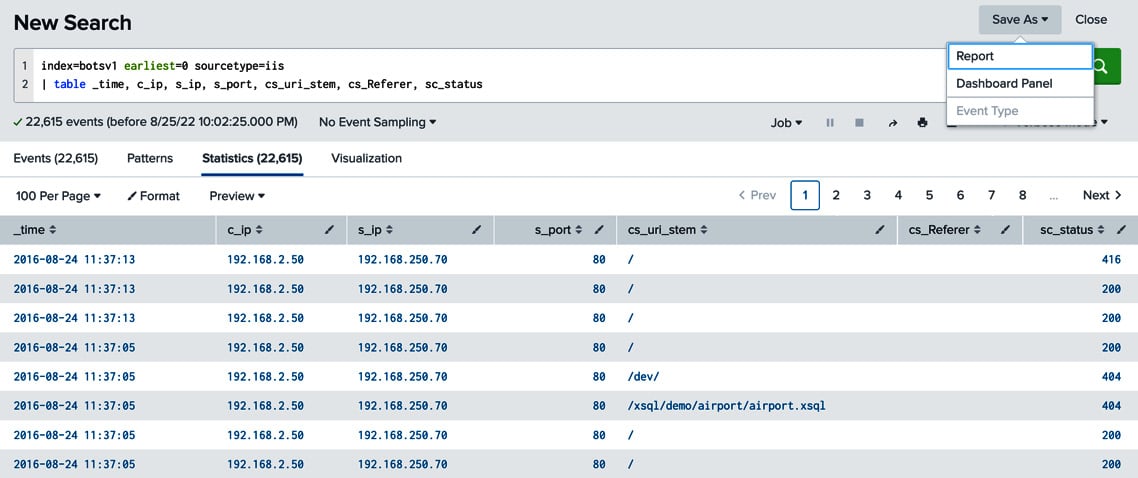
Figure 7.1 – Saving a search as a Dashboard Panel
Notice the Save As dropdown in the top-right corner of the search bar. This dropdown allows you the save the results of the query as a single report or as a dashboard panel. A Splunk report is the saved results of a single search. A Splunk dashboard can comprise several different objects, including reports, housed in one or more panels.
- Let’s click on the Dashboard Panel option to save the search results...