
Adding inputs, tokens, and drilldowns
One of the advantages of Splunk is the ability to search through data. So far, we have created static dashboards. In this section, we will add inputs that will allow us to create filters for the data. We can add several different inputs to the dashboard, including the following:
- Text
- Radio buttons
- Dropdowns
- Checkboxes
- Multiselect dropdowns
- Link lists
- Time pickers
- Submit buttons
Follow these steps to create a new Text filter:
- Clicking on the Add Input dropdown at the top of the dashboard while in Edit mode gives you a list of all the available options (see Figure 7.12):
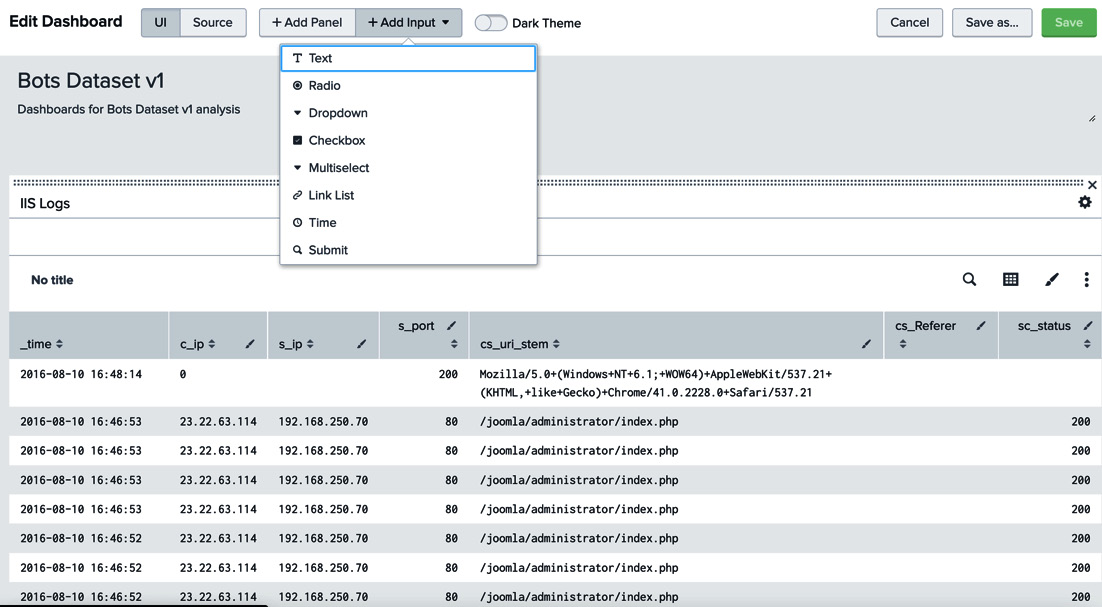
Figure 7.12 – Available input options
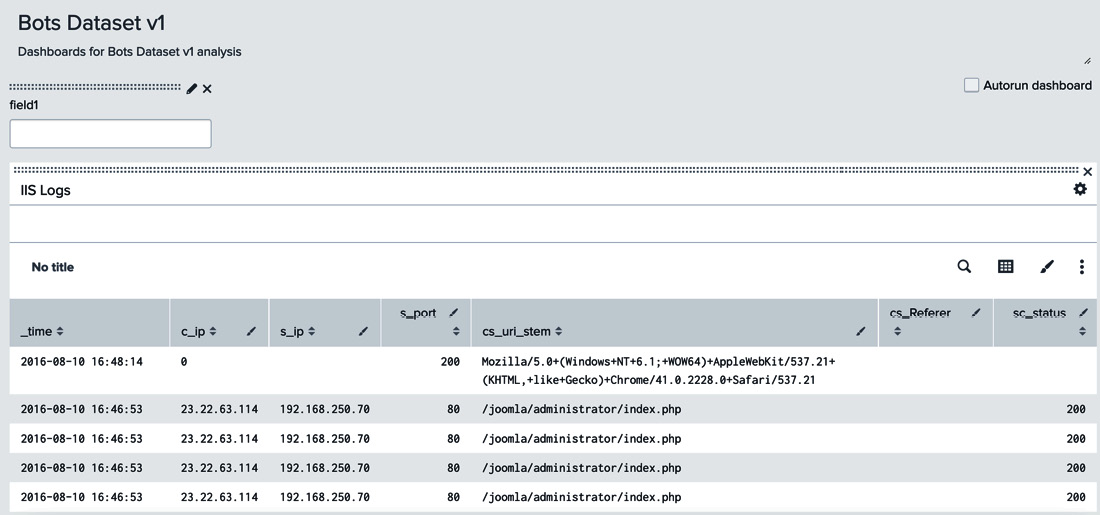
Let’s start with a new text box field for the IIS Logs dashboard panel.
- Click on the Add Input dropdown and select Text. A new input field called field1 will be added to the dashboard, as shown in Figure 7.13: