

Adding reports and drilldowns to dashboards
The dashboard panels we have created so far are powered by inline searches. We can also create panels where the search results are generated by reports. Let’s start by generating a report using one of the charts we created in Chapter 6, Creating Tables and Charts Using SPL. Enter the following query in the search bar:
index=botsv1 sourcetype=wineventlog EventCode=4624
| stats values(Account_Name) as users by host
This query generates the Account_Name property of all the users who successfully logged in to Windows grouped via the host device. Figure 7.33 shows the results:
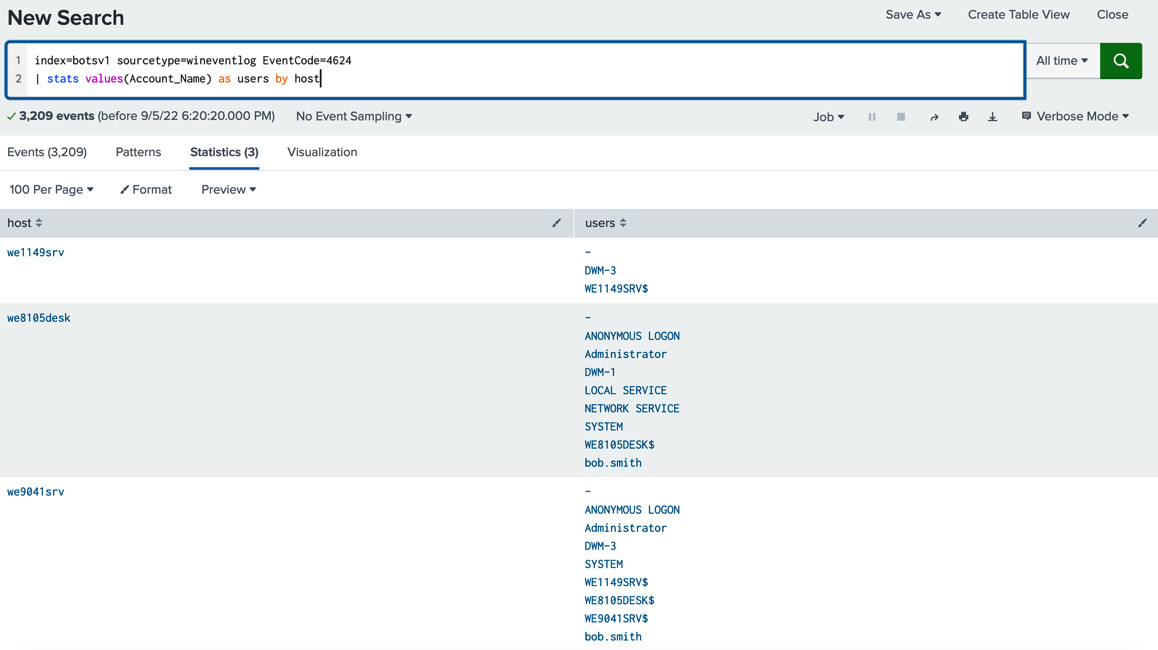
Figure 7.33 – Successful Windows logins
Let’s save these new results as a new report by clicking the Save As dropdown and selecting Report (see Figure 7.34):
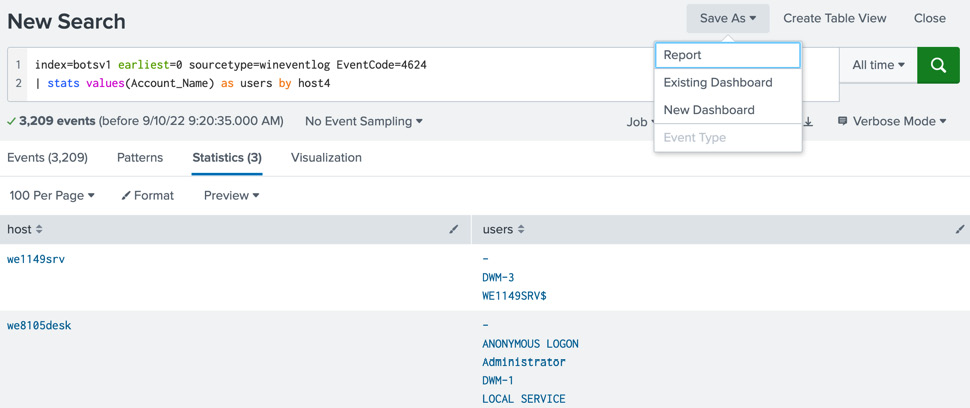
Figure 7.34 – Saving as a report
Enter the following in the Save As Report dialog box and leave the remaining options as...