
As we saw in linear regression, Ordinary Least Square (OLS) estimates the value of  in such a way that the sum of squares of residual
  is minimized.
Since  is an estimate we compute from a given sample and it's not a true population parameter, we need to be careful of certain characteristics of an estimate. The two such primary characteristics are the bias and the variance.
If  is the fit at the
  value of
  , then the average (or expected)
  on the test dataset could be decomposed into three quantities, the variance, the squared bias, and the variance of error terms as represented by the following equation:

For the best estimate, a suitable algorithm such as OLS should simultaneously achieve low bias and low variance. We commonly call this the Bias-Variance trade off. The popular bull's eye picture shown in the following figure helps understand the various scenarios of the tradeoff:
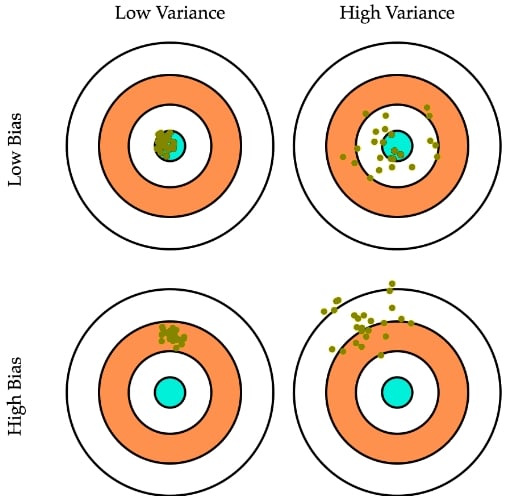
Figure 4.14: The popular bull's eye picture for explaining Bias and Variance scenarios
The bull's...