
Understanding MPdist
Now that we know about the Matrix Profile, we are ready to learn about MPdist and how the Matrix Profile is used in the calculation of MPdist. The paper that defines the MPdist distance is Matrix Profile XII: MPdist: A Novel Time Series Distance Measure to Allow Data Mining in More Challenging Scenarios, written by S. Gharghabi, S. Imani, A. Bagnall, A. Darvishzadeh, and E. Keogh (https://ieeexplore.ieee.org/abstract/document/8594928).
The intuition behind MPdist is that two time series can be considered similar if they have similar patterns throughout their duration. Such patterns are extracted in the form of subsequences using a sliding window. This is illustrated in Figure 7.2:
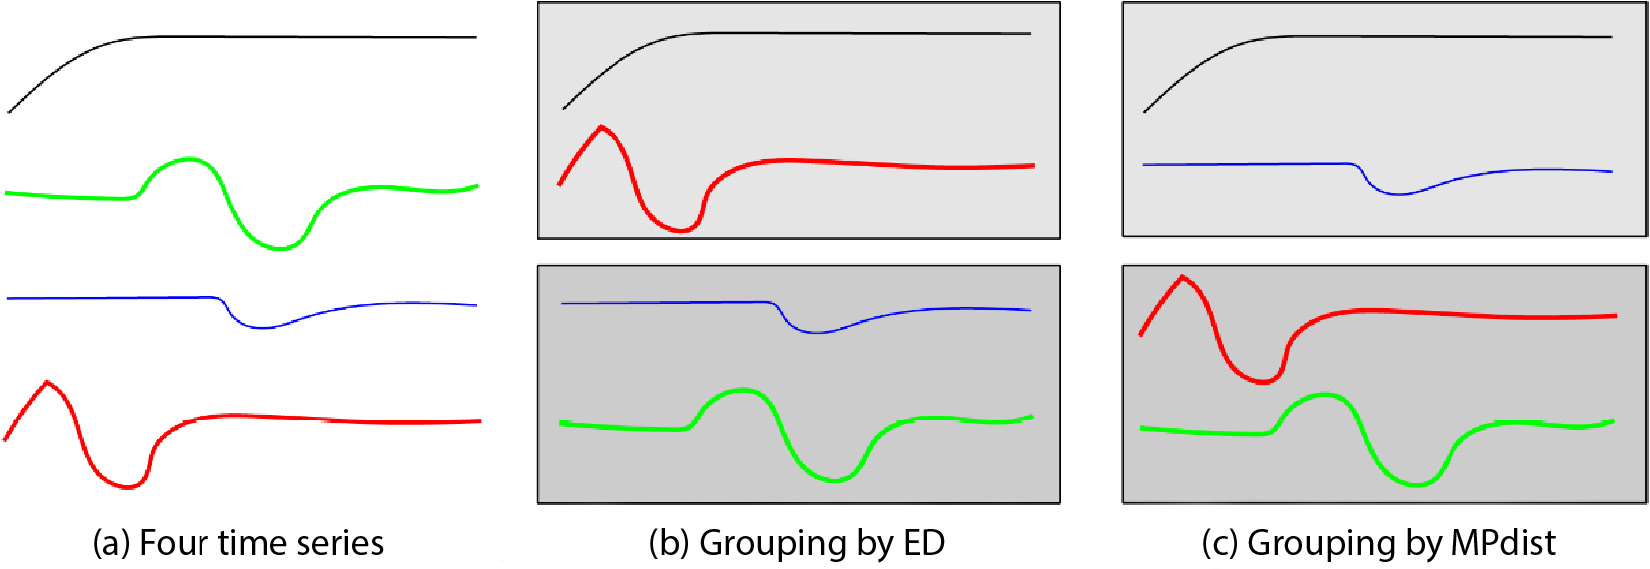
Figure 7.2 – Grouping time series
In Figure 7.2, we see that MPdist (c) understands the similarity between time series that follow the same pattern better, whereas Euclidean distance (b) compares time series based on time, and therefore groups the...