-
Book Overview & Buying
-
Table Of Contents

Mapbox Cookbook
By :
Mapbox Cookbook
By:
Overview of this book
Maps are an essential element in today’s location aware applications. Right from displaying earth surface information to creating thematic maps displaying plethora of information, most of the developers lack the necessary knowledge to create customizable maps with combination of various tools and libraries. The MapBox platform is one such platform which offers all the tools and API required to create and publish a totally customizable map.
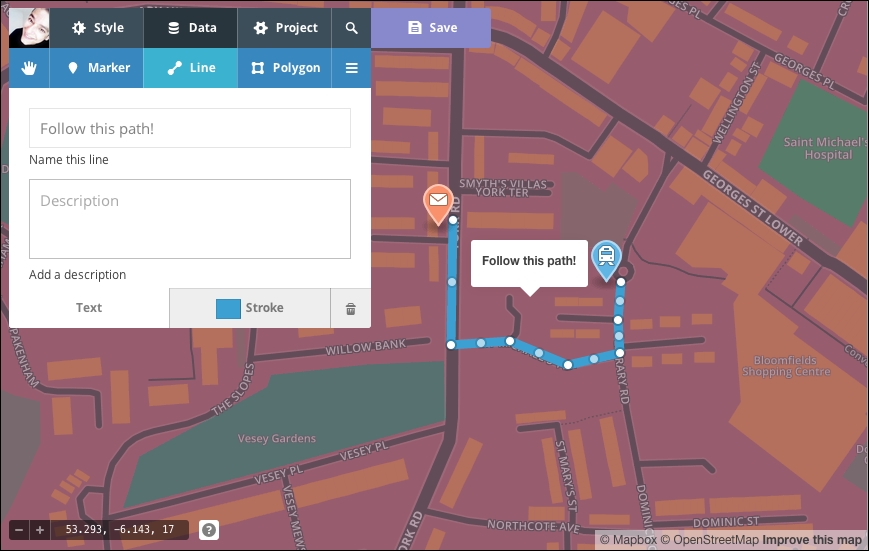
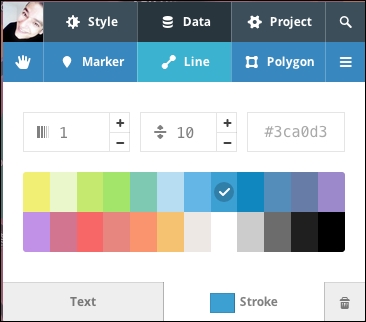
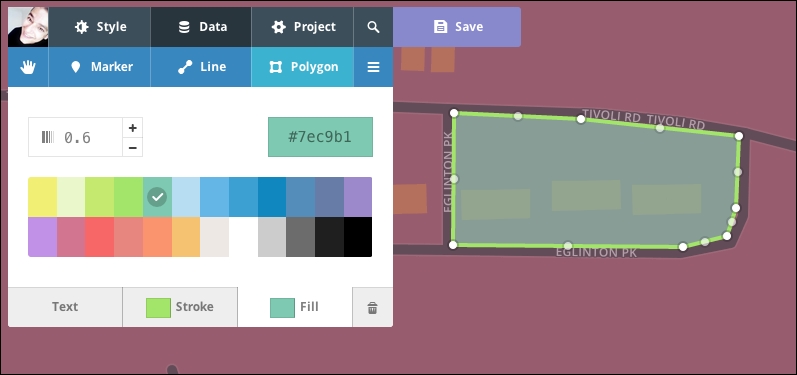
Starting with building your first map with the online MapBox Editor, we will take you all the way to building advanced web and mobile applications with totally customizable map styles. Through the course of chapters we’ll learn CartoCSS styling language and understand the various components of MapBox platform and their corresponding JavaScript API.
In the initial few chapters we will dive deeper into the TileMill and MapBox Studio components of MapBox and use them to generate custom styled map tiles and vector maps. Furthermore, we will publish these custom maps using PHP, node.js and third party tools like Geoserver.
We’ll also learn to create different visualizations and map styles like a choropleth map, a heat map and add user interactivity using a UFTGrid. Moving on, we dive into advanced concepts and focus on integration with third party services like Foursquare, Google FusionTables, CartoDB, and Torque to help you populate and even animate your maps.
In the final chapter we’ll learn to use the Mapbox SDK to create and publish interactive maps for the iOS platform. By the end of this book, you will learn about MapBox GL and how to create a fully functional, location-aware mobile app, using the maps styles created in the recipes.
Table of Contents (8 chapters)
Preface

 Free Chapter
1. Introduction to Mapbox
2. Mapbox Services
3. TileMill and Mapbox Studio
4. Mapbox.js
5. Mapbox.js Advanced
6. Mapbox GL
Index