Book Image

Python GUI Programming with Tkinter, 2nd edition - Second Edition

By : Alan D. Moore
4.5 (2)
Book Image

Python GUI Programming with Tkinter, 2nd edition - Second Edition

4.5 (2)
By: Alan D. Moore

Overview of this book

Tkinter is widely used to build GUIs in Python due to its simplicity. In this book, you’ll discover Tkinter’s strengths and overcome its challenges as you learn to develop fully featured GUI applications. 
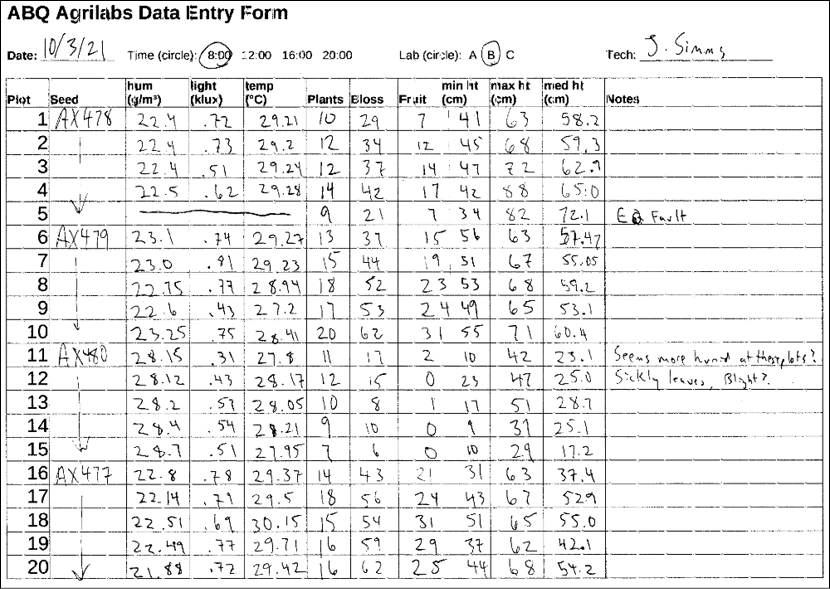
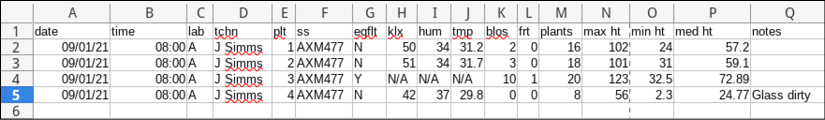
Python GUI Programming with Tkinter, Second Edition, will not only provide you with a working knowledge of the Tkinter GUI library, but also a valuable set of skills that will enable you to plan, implement, and maintain larger applications. You’ll build a full-blown data entry application from scratch, learning how to grow and improve your code in response to continually changing user and business needs. You’ll develop a practical understanding of tools and techniques used to manage this evolving codebase and go beyond the default Tkinter widget capabilities. You’ll implement version control and unit testing, separation of concerns through the MVC design pattern, and object-oriented programming to organize your code more cleanly. You’ll also gain experience with technologies often used in workplace applications, such as SQL databases, network services, and data visualization libraries. Finally, you’ll package your application for wider distribution and tackle the challenge of maintaining cross-platform compatibility.
Table of Contents (22 chapters)
19
Other Books You May Enjoy
20
Index
Appendices

Analyzing a problem at ABQ AgriLabs

Congratulations! Your Python skills have landed you a great job as a data analyst at ABQ AgriLabs. So far, your job is fairly simple: collating and doing simple data analysis on the CSV files sent to you daily by the lab's data entry staff.

There is a problem, though. You've noted with frustration that the quality of the CSV files from the lab is sadly inconsistent. Data is missing, typos abound, and often the files have to be re-entered in a time-consuming process. The lab director has noticed this as well and, knowing that you are a skilled Python programmer, she thinks you might be able to help. You've been enlisted to program a solution that will allow the data entry staff to enter lab data into a CSV file with fewer mistakes. Your application needs to be simple and allow as little room for error as possible.

Assessing the problem

Spreadsheets are often a first stop for computer users who need to keep track of data. Their table-like layouts and computational features seem to make them ideal for the task.

However, as a set of data grows and is added to by multiple users, the shortcomings of spreadsheets become apparent: they don't enforce data integrity, their table-like layout can be visually confusing when dealing with long rows of sparse or ambiguous data, and users can easily delete or overwrite data if they aren't being careful.

To improve this situation, you propose to implement a simple GUI data entry form that appends data to a CSV file in the format we need. Forms can help to improve data integrity in several ways:

  • They can enforce the type of data to be entered (for example, numbers or dates).
  • They can verify that entered data is within expected ranges, matches expected patterns, or is within a valid set of options.
  • They can auto-fill information such as current dates, times, and usernames.
  • They can ensure that required data fields have not been left empty.

By implementing a well-designed form, we can greatly reduce the amount of human error from the data entry staff. Where do we begin?

Gathering information about the problem

To build a truly effective data entry application, you need to do more than just throw some entry fields on a form. It's important to understand the data and the workflow around the data from all sides of the problem. It's also important to understand the human and technological limitations that you need to accommodate. To do that, we need to speak with a few different parties:

  • The originators of the data for the application – in this case, the lab technicians who check the plots in each lab. They can help us understand the significance of the data, the possible values, and the possible outlier situations where the data might need special handling.
  • The users of our application – in this case, the data entry staff. We need to understand what the data looks like when they receive it, what their workflow is like for entering the data, what practical or knowledge limitations they face, and ultimately how our software can make their job easier rather than harder.
  • The consumers of the data from the application – that is, everyone who will use the CSV files (including you!). What are their expectations for the output of this application? How would they like outlier situations to be handled? What are their goals in keeping and analyzing the data?
  • The support staff who are involved with the systems that will run or consume data from your application. What sort of technologies need to be supported? What technological limitations need to be accommodated? What security concerns need to be addressed?

Sometimes these groups overlap, of course. In any case, it's important to think through everyone whose job will be affected by the data and the software, and take their needs into consideration as you design your application. So, before we start coding away, we're going to put together some questions to help us gather these details.

Interviewing the interested parties

The first group you'll talk to are the lab technicians, from whom you'll try find out more detail about the data being recorded. This isn't always as easy as it sounds. Software needs absolute, black-and-white rules when dealing with data; people, on the other hand, tend to think in generalities about their data, and they often don't consider the exact details of limits or edge cases without some prompting. As an application designer, it's your job to come up with questions that will bring out the information you need.

Here are some questions we can ask the lab technicians to learn more about the data:

  • What values are acceptable for character fields? Are any of them constrained to a discrete set of values?
  • What units are represented by each of the numeric fields?
  • Are numeric fields truly number-only fields? Would they ever need letters or symbols?
  • What range of numbers is acceptable for each numeric field?
  • How is unavailable data (such as from an equipment failure) notated?

Next, let's interview the users of the application. If we're making a program to help reduce user error, we have to understand those users and how they work. In the case of this application, our users will be the data entry staff. We need to ask them questions about their needs and workflow so that we can create an application that works well for them.

Here are some good questions we can ask the data entry staff:

  • How is the data formatted when you receive it?
  • When is the data received and how soon is it entered? When's the latest it might be entered?
  • Are there fields that could be automatically populated? Should users be able to override the automatic values?
  • What's the overall technical ability of the users? Are they strong typists, or would they prefer a mouse-driven interface?
  • What do you like about the current solution? What do you dislike?
  • Do any users have visual or manual impairments that should be accommodated?

    Listen to your users! When talking to users about an application design, they may often put forward requests or ideas that are impractical, that don't follow best practice, or that seem frivolous. For example, they may request that a button display an animation under certain conditions, that a particular field be yellow, or that a time field be represented as a set of dropdowns for hours and minutes. Rather than dismissing these ideas, try to understand the reasoning behind them, or the problem that prompted them. It will often uncover aspects of the data and the workflow you did not understand before, and lead to a better solution.

Once we have spoken with our users, it's time to talk to the consumers of our data. In this case, that's you! You already know a good deal about what you need and expect from the data, but even so, it's important to reflect and consider how you would ideally like to receive data from this application. For example:

  • Is CSV really the best output format, or is that just what has always been used?
  • Does the order of fields in the CSV matter? Are there constraints on the header values (no spaces, mixed case, and so on)?
  • How should outlier cases be handled by the application? What should they look like in the data?
  • How should different objects like Boolean or date values be represented in the data?
  • Is there additional data that should be captured to help you accomplish your goals?

Finally, we need to understand the technology that our application will be working with; that is, the computers, networks, servers, and platforms available to accomplish the task. You come up with the following questions to ask the IT support staff:

  • What kind of computer does data entry use? How fast or powerful is it?
  • What operating system platform does it run?
  • Is Python available on these systems? If so, are there any Python libraries installed?
  • What other scripts or applications are involved in the current solution?
  • How many users need to use the program at once?

Inevitably, more questions will come up about the data, workflow, and technologies as the development process continues. For that reason, be sure to keep in touch with all these groups and ask more questions as the need arises.

Analyzing what we've found out

You've done all your interviews with the interested parties, and now it's time to look over your notes. You begin by writing down the basic information about operations at ABQ that you already know:

  • Your ABQ facility has three greenhouses, each operating with a different climate, marked A, B, and C
  • Each greenhouse has 20 plots (labeled 1 through 20)
  • There are currently four types of seed samples, each coded with a six-character label
  • Each plot has 20 seeds of a given sample planted in it, as well as its own environmental sensor unit

Information from the data originators

Your talk with the lab technicians revealed a lot about the data. Four times a day, at 8:00, 12:00, 16:00, and 20:00, each technician checks the plots in his or her assigned lab. They use a paper form to record information about plants and environmental conditions at each plot, recording all numeric values to no more than two decimal places. This usually takes between 45 and 90 minutes, depending on how far along the plant growth has progressed.

Each plot has its own environmental sensor that detects the light, temperature, and humidity at the plot. Unfortunately, these devices are prone to temporary failure, indicated by an Equipment Fault light on the unit. Since a fault makes the environmental data suspect, they simply cross out the fields in those cases and don't record that data.

They provide you with an example copy of the paper form, which looks like this:

Figure 2.1: Paper form filled out by the lab technicians

Finally, the technicians tell you about the units and possible ranges of data for the fields, which you record in the following chart:

Field

Data type

Notes

Date

Date

The data collection date. Usually the current date.

Time

Time

The start of the period during which measurements were taken. One of 8:00, 12:00, 16:00, or 20:00.

Lab

Character

The lab ID, either A, B, or C.

Technician

Text

The name of the technician recording the data.

Plot

Integer

The plot ID, from 1 to 20.

Seed Sample

Text

ID string for the seed sample. Always a six-character code containing digits 0 to 9 and capital letters A to Z.

Fault

Boolean

True if environmental equipment registered a failure, otherwise False.

Humidity

Decimal

The absolute humidity in g/m³, roughly between 0.5 and 52.0.

Light

Decimal

The amount of sunlight at the plot center in kilolux, between 0 and 100.

Temperature

Decimal

The temperature at the plot, in degrees C; should be between 4 and 40.

Blossoms

Integer

The number of blossoms on the plants in a plot. No maximum, but unlikely to approach 1,000.

Fruit

Integer

The number of fruits on the plant. No maximum, but unlikely to ever approach 1,000.

Plants

Integer

The number of plants in the plot; should be no more than 20.

Max Height

Decimal

The height of the tallest plant in the plot, in cm. No maximum, but unlikely to approach 1,000.

Median Height

Decimal

The median height of the plants in the plot, in cm. No maximum, but unlikely to approach 1,000.

Min Height

Decimal

The height of the smallest plant in the plot, in cm. No maximum, but unlikely to approach 1,000.

Notes

Long Text

Additional observations about the plant, data, instruments, and so on.

Information from the users of the application

Your session with the data entry staff yielded good information about their workflow and practical concerns. You learn that the lab technicians drop off their paper forms as they're completed, from which the data is typically entered right away and usually on the same day as it's handed in.

The data entry staff are currently using a spreadsheet (LibreOffice Calc) to enter the data. They like that they can use copy and paste to bulk-fill fields with repeated data like the date, time, and technician name. They also note that the autocompletion feature of LibreOffice is often helpful in text fields, but sometimes causes accidental data errors in the number fields.

You take these notes about how they enter data from the forms:

  • Dates are entered in month/day/year format, since this is how LibreOffice formats them by default with the system's locale setting.
  • Time is entered as 24-hour time.
  • Technicians are entered as first initial and last name.
  • In the case of equipment faults, the environmental data is entered as N/A.
  • The CSV file is generally created one lab at a time in plot order (from 1 to 20).

There are four data entry clerks in total, but only one working at any one time; while interviewing the clerks, you learn that one has red-green color blindness, and another has trouble using a mouse due to RSI issues. All are reasonably computer literate and prefer keyboard entry to mouse entry as it allows them to work faster.

One user in particular had some ideas about how your program should look. He suggested doing the labs as a set of checkboxes, and to have separate pop-up dialogs for plant data and environmental data.

Information from technical support

Speaking with IT personnel, you learn that the data entry staff have only a single PC workstation, which they share. It is an older system running Debian GNU/Linux, but it performs adequately. Python3 and Tkinter are already installed as part of the base system, though they are slightly older versions than you have on your workstation. The data entry staff save their CSV data for the current day to a file called abq_data_record.csv. When all the data is entered, the data entry staff have a script they can run to email you the file and build a new, empty file for the next day. The script also backs up the old file with a date-stamp so it can be pulled up later for corrections.

Information from the data consumer

As the main data consumer, it would be pretty easy for you to just stick with what you know already; nevertheless, you take the time to review a recent copy of abq_data_record.csv, which looks something like this:

Figure 2.2: The abq_data_record.csv file

In reflecting on this, you realize there are a few changes to the status quo that could make life easier for you as you do your data analysis:

  • It would be great to have the files date-stamped right away. Currently, you have an inbox full of files called abq_data_record.csv and no good way to tell them apart.
  • It would be helpful if the data in the files were saved in a way that Python could more easily parse without ambiguity. For example, dates are currently saved with the local month/day/year formatting, but ISO-format would be less problematic.
  • You'd like a field that indicates explicitly when there is an equipment fault, rather than just implying it with missing environmental data.
  • The N/A is something you just have to filter out when you process the data. It would be nice if an equipment fault would just blank out the environmental data fields so that the file doesn't contain useless data like that.
  • The current CSV headers are cryptic, and you're always having to translate them in your report scripts. It would be good to have readable headers.

These changes won't just make your job easier, they will also leave the data in a more usable state than it was before. Legacy data formats like these CSV files are often fraught with artifacts from obsolete software environments or outdated workflows. Improving the clarity and readability of the data will help anyone trying to use it in the future as the lab's usage of the data evolves.