

vue-devtools is a must for every Vue developer. This tool shows us the depths of the Vue components, routes, events, and Vuex.
With the help of the vue-devtools extension, it's possible to debug our application, try new data before changing our code, execute functions without needing to call them in our code directly, and so much more.
In this recipe, we will learn more about how to use various devtools to find out more about our application and how they can be used to help with our debug process.
Getting ready
The prerequisite for this recipe is Node.js 12+.
The Node.js global objects that are required for this recipe are as follows:
- @vue/cli
- @vue/cli-service-global
You will need to install the vue-devtools extension in your browser:
- Chrome extension: http://bit.ly/chrome-vue-devtools
- Firefox extension: http://bit.ly/firefox-vue-devtools
We can continue with our to-do list project or create a new Vue project with the Vue CLI, as we learned in the Creating your first project with the Vue CLI recipe.
How to do it...
When developing any Vue application, it's always a good practice to develop with vue-devtools at hand.
Follow these steps to understand how to use vue-devtools and how to properly debug a Vue application:
- To enter vue-devtools, you need to have it installed in your browser, so check the Getting ready section of this recipe for the links to the extension for Chrome or Firefox. In your Vue development application, enter the Browser developer inspector mode. A new tab called Vue will appear:
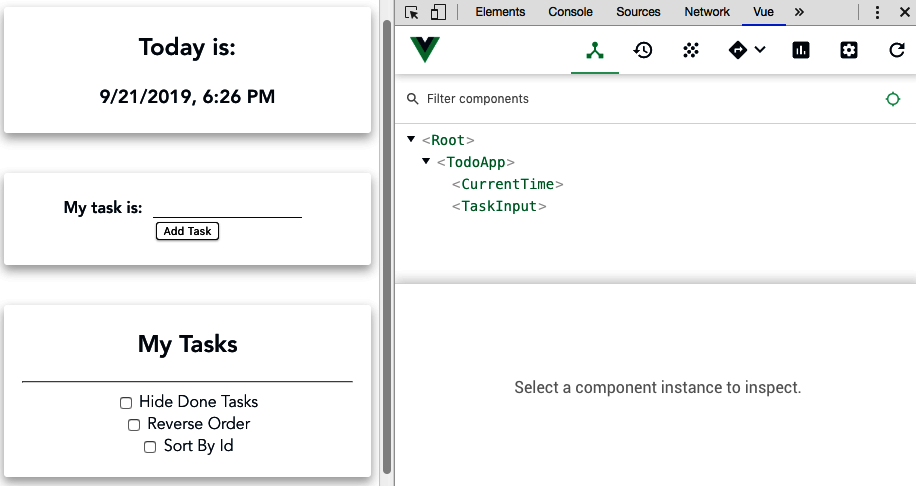
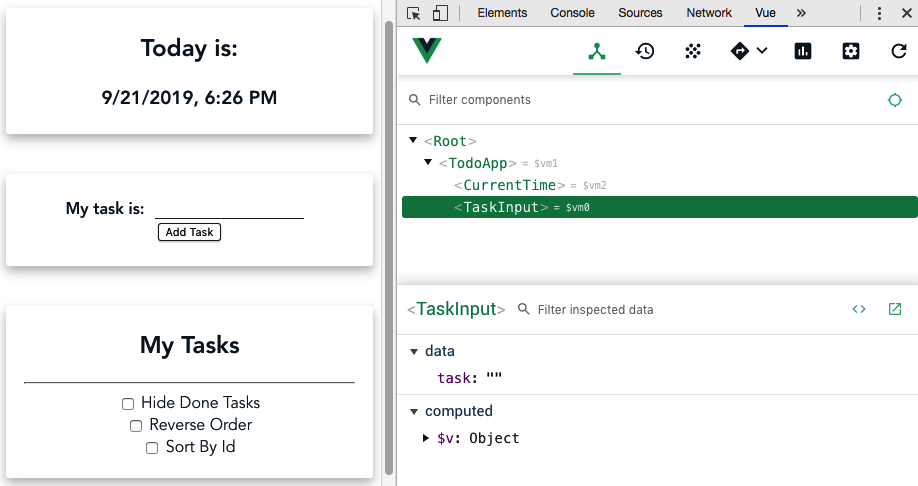
- The first tab that you will be presented with is the Components tab. This tab shows your application component tree. If you click on a component, you will be able to see all the available data, the computed property, and extra data that's been injected by plugins such as vuelidate, vue-router, or vuex. You can edit this data to see the changes in the application in real time:
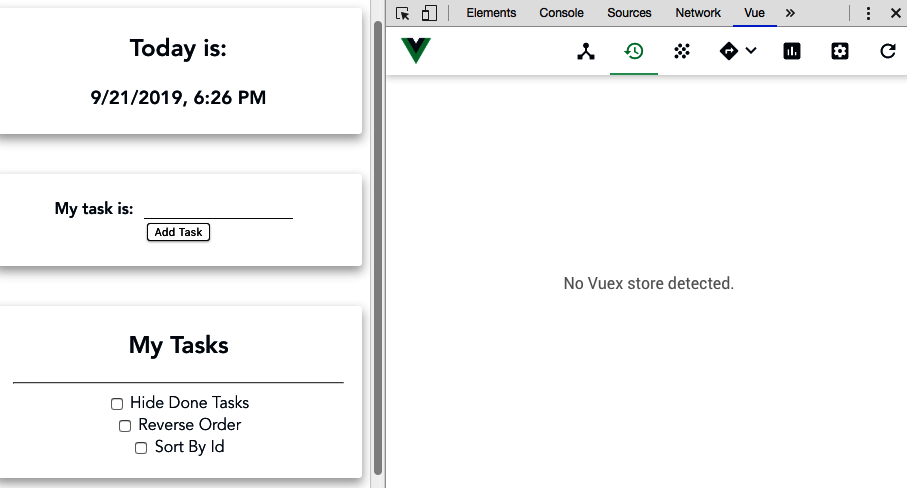
- The second tab is for Vuex development. This tab will show the history of the mutations, the current state, and the getters. It's possible to check on the passed payload for each mutation and do time-travel mutations, to go back in time and look at the Vuex changes in the states:
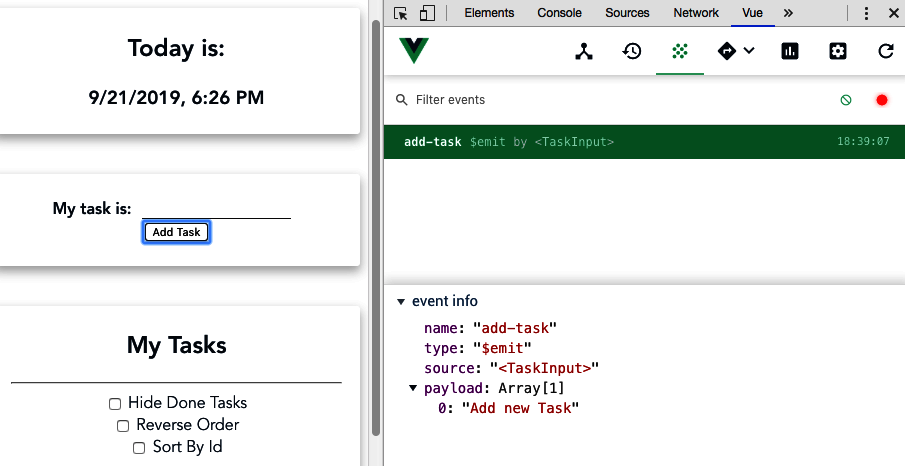
- The third tab is dedicated to Event emitters in the application. All events that are emitted in the application will be shown here. You can check the event that was emitted by clicking on it. By doing this, you can see the name of the event, the type, who was the source of the event (in this case, it was a component), and the payload:
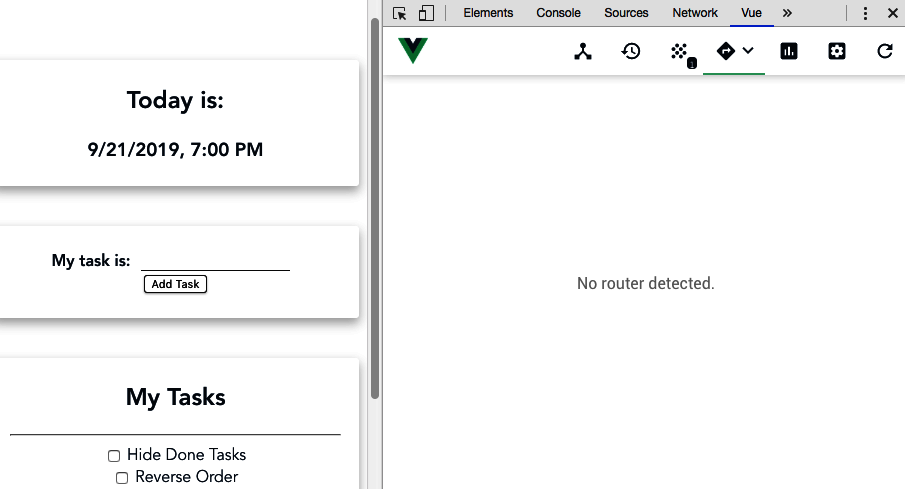
- The fourth tab is dedicated to the vue-router plugin. There, you can view its navigation history, along with all the metadata that was passed to the new route. This is where you can check all the available routes in your application:
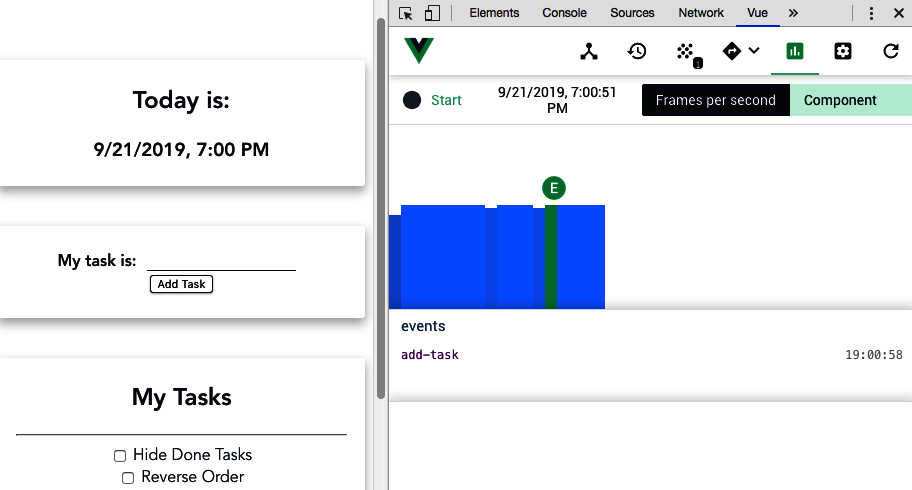
- The fifth tab is the Performance tab. Here, you can check your component's loading time and the frames per second that your application is running at for the events that are happening in real time. The following screenshot shows the current frames per second of the current application, and for the selected component:
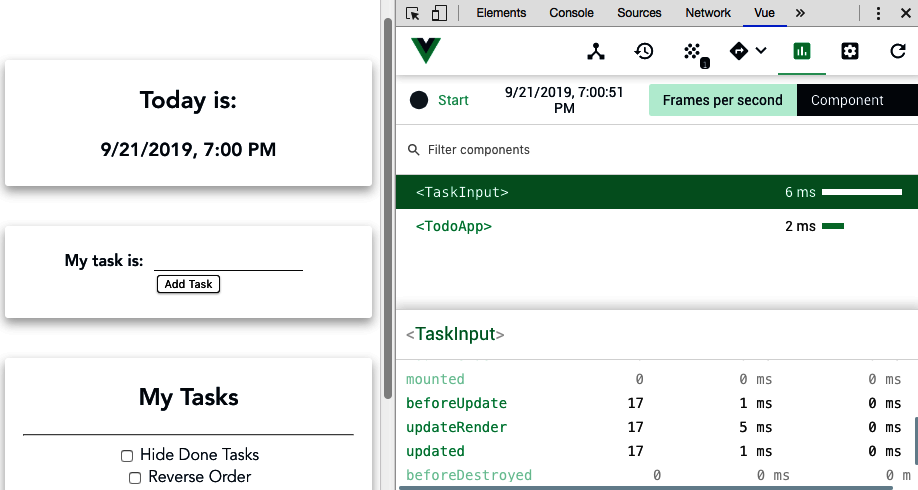
The following screenshot shows the component's life cycle hook performance and the time it took to execute each hook:
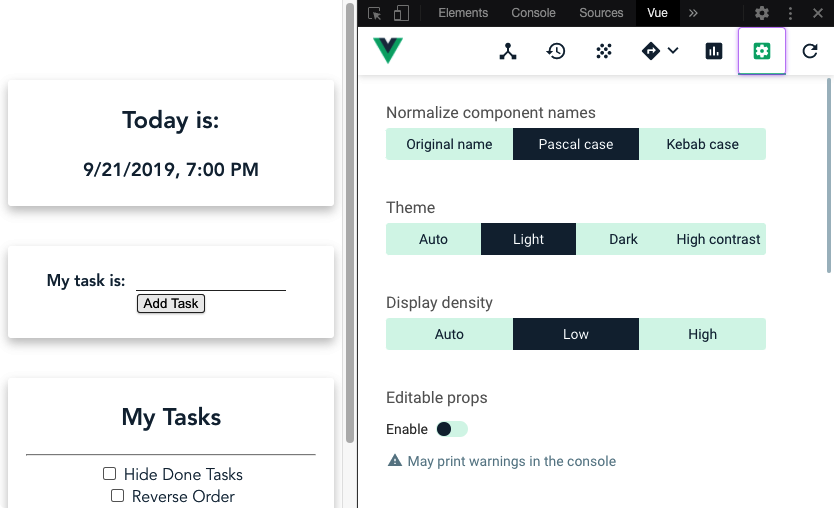
- The sixth tab is your Settings tab. Here, you can manage the extension and change how it looks, how it behaves internally, and how it will behave within the Vue plugins:
- The last tab is a refresh button for vue-devtools. Sometimes, when hot-module-reload occurs or when some complex events occur in your application component tree, the extension can lose track of what is happening. This button forces the extension to reload and read the Vue application state again.
See also
You can find more information about vue-devtools at https://github.com/vuejs/vue-devtools.