Book Image

Java Data Analysis

By : John R. Hubbard
Book Image

Java Data Analysis

By: John R. Hubbard

Overview of this book

Data analysis is a process of inspecting, cleansing, transforming, and modeling data with the aim of discovering useful information. Java is one of the most popular languages to perform your data analysis tasks. This book will help you learn the tools and techniques in Java to conduct data analysis without any hassle. After getting a quick overview of what data science is and the steps involved in the process, you’ll learn the statistical data analysis techniques and implement them using the popular Java APIs and libraries. Through practical examples, you will also learn the machine learning concepts such as classification and regression. In the process, you’ll familiarize yourself with tools such as Rapidminer and WEKA and see how these Java-based tools can be used effectively for analysis. You will also learn how to analyze text and other types of multimedia. Learn to work with relational, NoSQL, and time-series data. This book will also show you how you can utilize different Java-based libraries to create insightful and easy to understand plots and graphs. By the end of this book, you will have a solid understanding of the various data analysis techniques, and how to implement them using Java.
Table of Contents (20 chapters)
Java Data Analysis
Credits
About the Author
About the Reviewers
www.PacktPub.com
Customer Feedback
Preface
Index

Similarity measures


A similarity measure is like an inverse distance function. In fact, if d(y, z) is a distance function on the set of all items, we could use this:

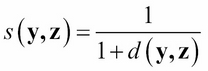
as a similarity measure. You can check that this would satisfy the six properties for a similarity measure, enumerated previously.

Without a predefined distance function to use, we instead will want to define the similarity measure in terms of the contents of the given utility matrix. There are several ways to do this.

If the utility matrix is Boolean (that is, every entry uij is either 1 or 0, indicating whether user i has bought an item), then we could adapt the Hamming metric. In this case, each column of the utility matrix is a Boolean vector, indicating which users have bought that item. The Hamming distance between two Boolean vectors is the number of vector slots where they differ. For example, if y = (1, 1, 1, 0, 0, 1, 0, 0) and z = (1, 0, 1, 1, 1, 0, 0, 1), then the Hamming distance between y and z is dH(y, z) = 5, because...