

Exploring cost analysis in the Azure portal
Microsoft Azure has the most advanced, free, in-portal capability to analyze the cost of your workload. Let’s look at the Cost Management + Billing feature in the portal. You will learn how to do the following:
- Identify the offer type for your subscription(s)
- View the accumulated and forecasted cost
- View the cost grouped by service
- View the cost grouped by management group
- View the cost grouped by tag
- View the create, save, and share custom cost analysis views
Let’s look at how to accomplish these tasks using the Azure Cost Management + Billing feature in the portal.
Identifying the offer type for your subscription(s)
When you purchase or create a Microsoft Azure subscription, an Azure offer governs the payment terms and conditions, service rate, exclusions, payment options, cancellation policy, and service agreement between your organization and Microsoft. Here is how you can find out the offer type in the Azure portal:
- Open the Microsoft Edge browser.
- Navigate to https://portal.azure.com/#view/Microsoft_Azure_CostManagement/Menu/~/overview and then click on Cost Analysis.
- Click on Properties, under the Settings section. The Type field indicates your subscription’s offer type. The following screenshot shows that the subscription has an MCA offer type.
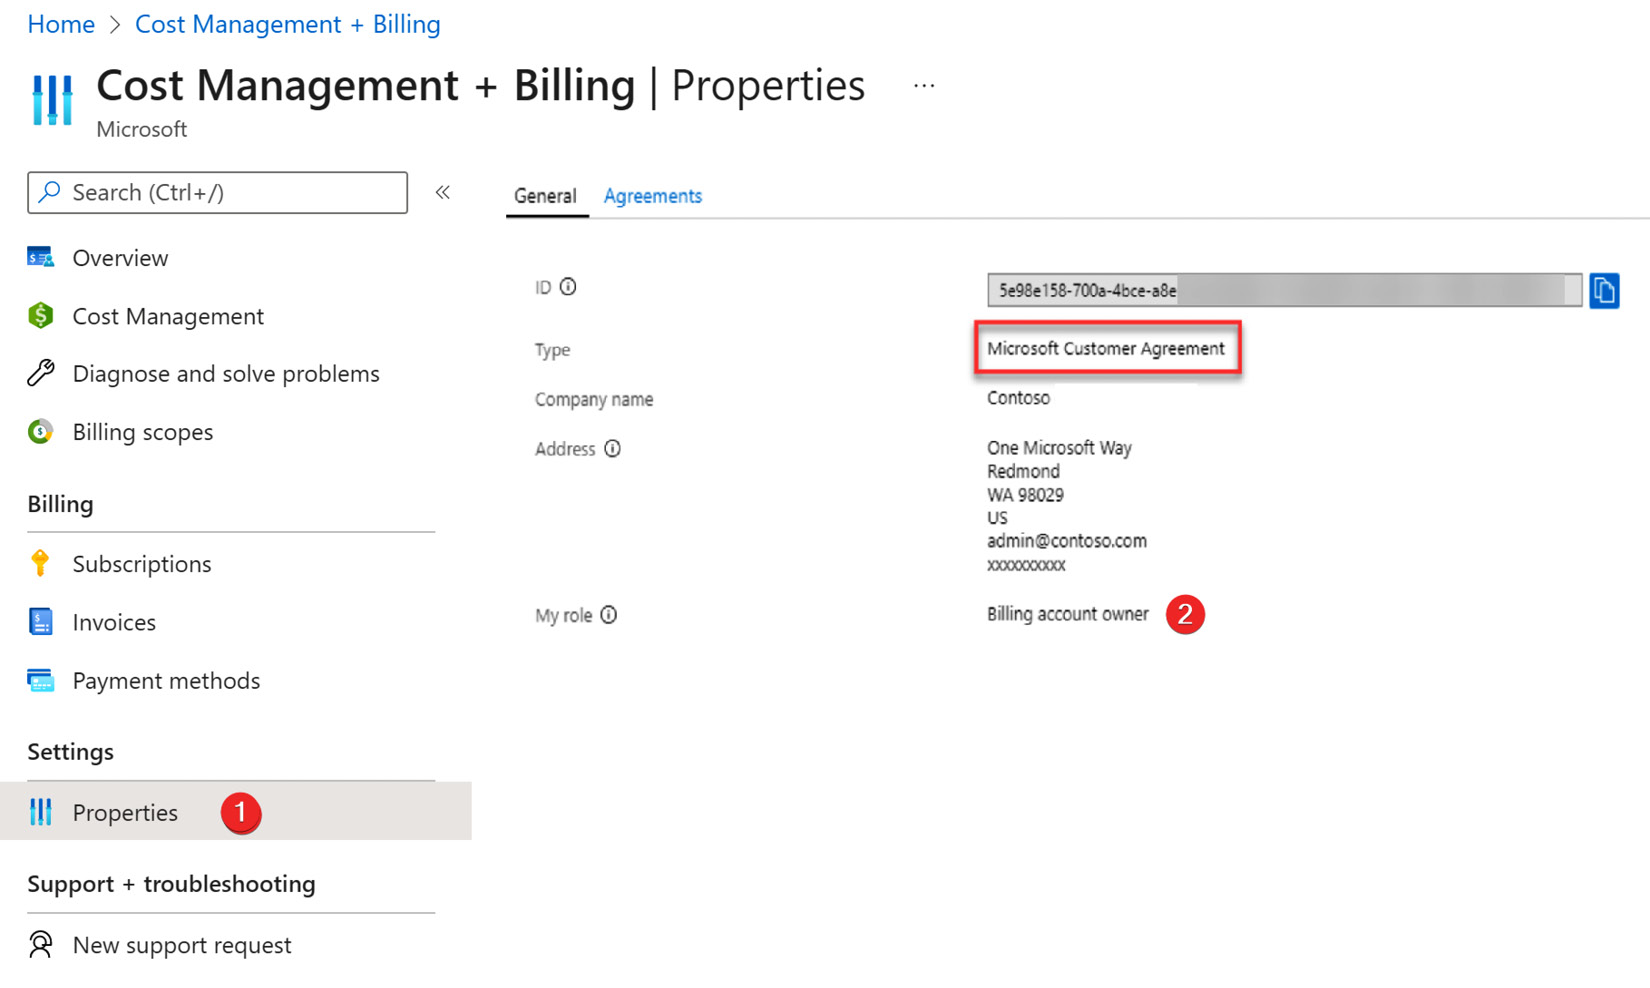
Figure 1.11 – Azure Cost Management + Billing
There are many different types of offers available in Azure. To view the full list and details about each offer, please check out https://azure.microsoft.com/en-us/support/legal/offer-details/.
Accumulated and forecasted cost
One of the most common requests from the finance and procurement team is to provide accumulated and forecasted costs for the workloads running in Azure. To accomplish this request, you can use the built-in accumulated cost view. Furthermore, you can share the view directly with the finance and procurement team or export the data in PNG, Excel, or CSV format for further analysis. The forecasted cost is based on your historical resource usage and shows a prediction of your estimated cost for up to a year.
Open Cost Management + Billing in the Azure portal and then click on Cost Analysis. The default Cost Analysis view will display actual and forecasted costs.
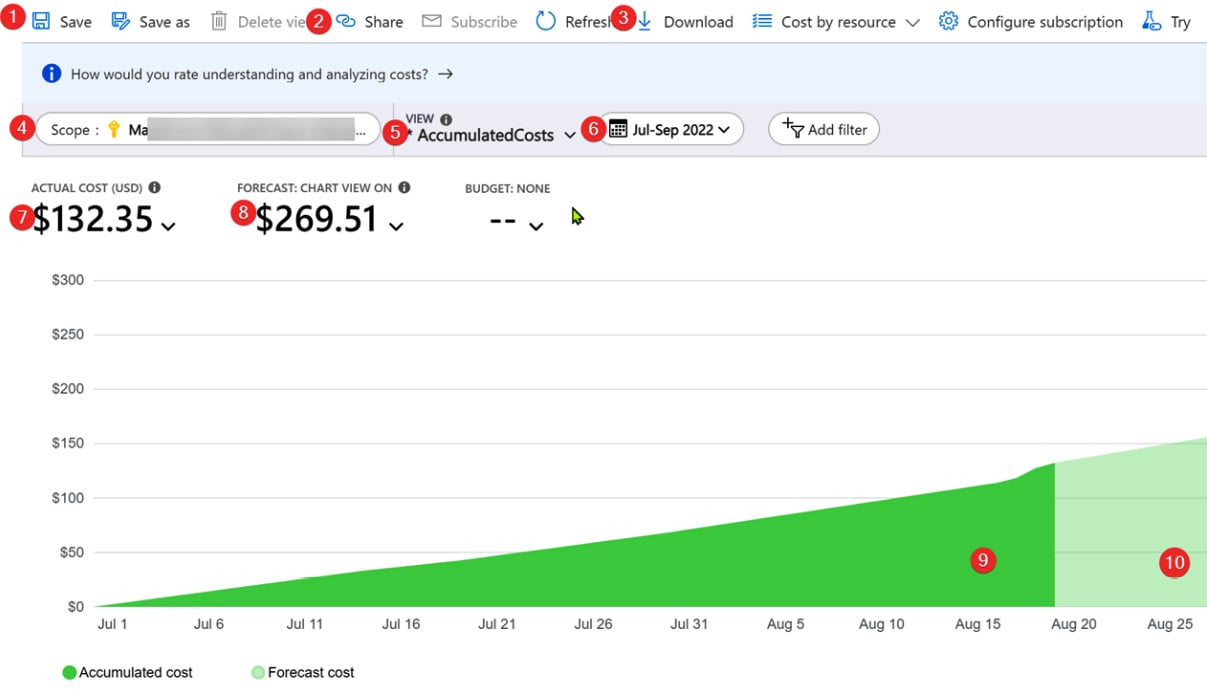
Figure 1.12 – The Azure Cost Analysis feature
Since this is the first time we are looking at Cost Management + Billing, let’s get familiar with its key features:
- You can create many different views with customizations such as date ranges, scope, filter by service or tag, group by location or resource, and so on. Then, using the Save button at the top, you can create a new customized view.
- To share the view directly, use the Share button. It provides a direct URL to the cost management view. Remember that appropriate RBAC permissions will be required for the viewer to access the report.
- Using the Download button, you can download the image or data (as a CSV or Excel file) and share it with others.
- The Scope filter allows you to restrict the cost analysis to a subscription or management group.
- The VIEW dropdown shows built-in views such as accumulated cost, daily cost, cost by service, and any custom views that you may have saved earlier.
- The date range filter provides options to view your costs daily, monthly, quarterly, or yearly, or select a custom date range.
- The ACTUAL COST (USD) option shows the total cost. For Enterprise Agreement accounts, this includes all usage, reservations, and marketplace purchases.
- The FORECAST: CHART VIEW ON option shows the predicted cost based on your usage in the past.
- The dark color shows your accumulated cost.
- The light color shows your forecasted cost.
Now, you can provide the actual resource cost by selecting the right scope and date range.
We will take a deeper look at forecasting cost in Chapter 3, Forecasting the Future Spend.
Cost grouped by service
In this task, we will drill down the cost to the service level to better understand the parts of your infrastructure that cost more. This view helps you understand the primary cost drivers and enables you to adjust the service usage to control the cost:
- Open Cost Management + Billing in the Azure portal and then click on Cost Analysis.
- Change the view to CostByService and select the appropriate date range.
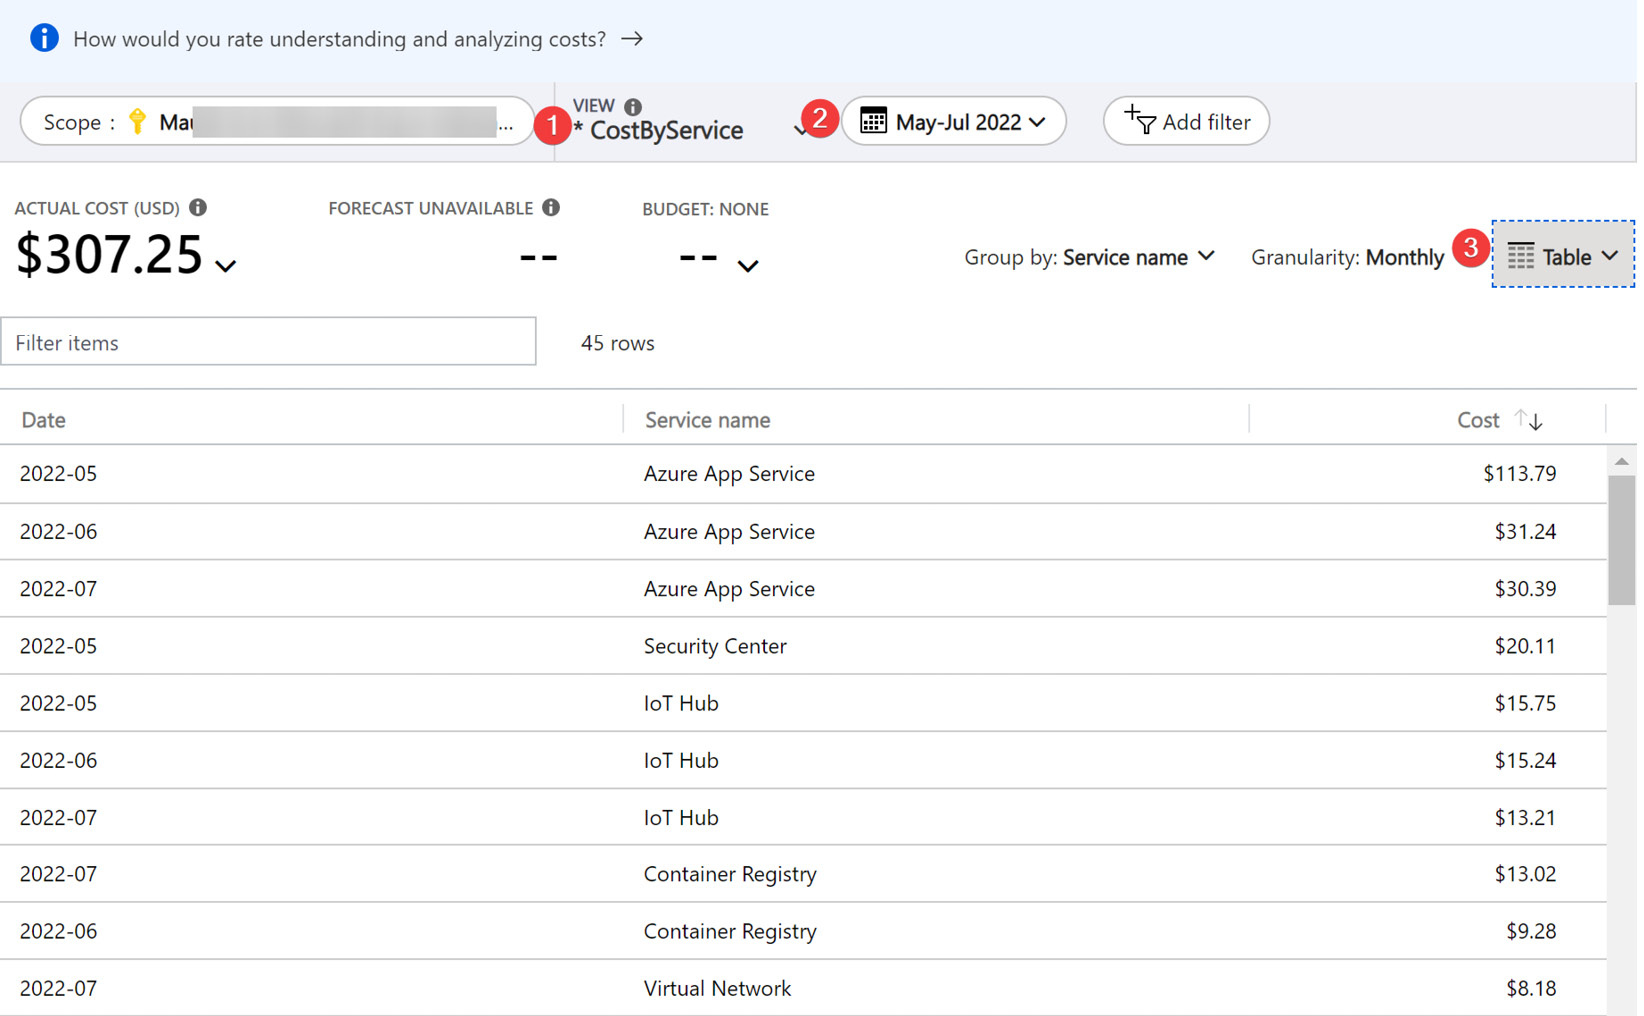
Figure 1.13 – Cost grouped by services
- Set the view to Table to see the data in table format.
Often, you will want to see the networking (virtual network, bandwidth, and so on) versus compute versus storage cost. This view provides all these details and enables you to create custom reports by exporting data into Excel.
Cost grouped by management group
Management groups in Azure provide you with an efficient way to manage resources, access, policies, and compliance by logically grouping the subscriptions. The management group hierarchy has also extended to Cost Management + Billing. Now, the cost management scope filter supports management group-based filtering. Let’s look at an example. The engineering vice president wants to know how much money we are spending to host corporate intranet applications versus customer-facing online business applications to calculate the overhead cost. To provide this data, follow these steps:
- Open Cost Management + Billing in the Azure portal and then click on Cost analysis.
- Change the Scope filter to -corp management group under the landing zone. This will provide costs for all the subscriptions hosting internal corporate applications.
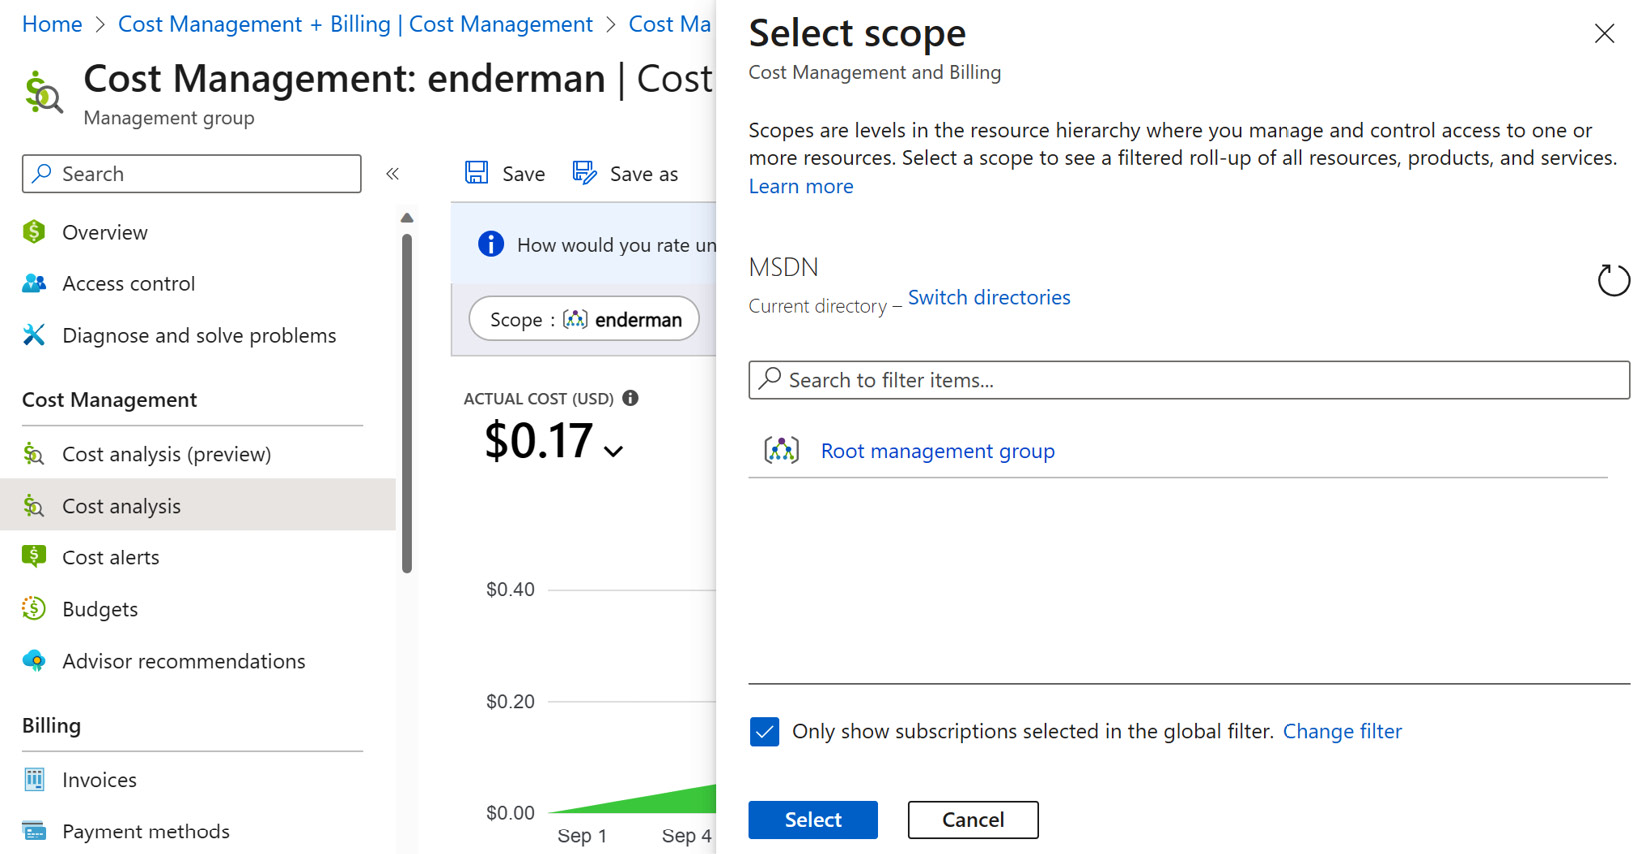
Figure 1.14 – Root management group
- To provide the cost for online business-facing applications, change the scope to the online management group under the landing zone.
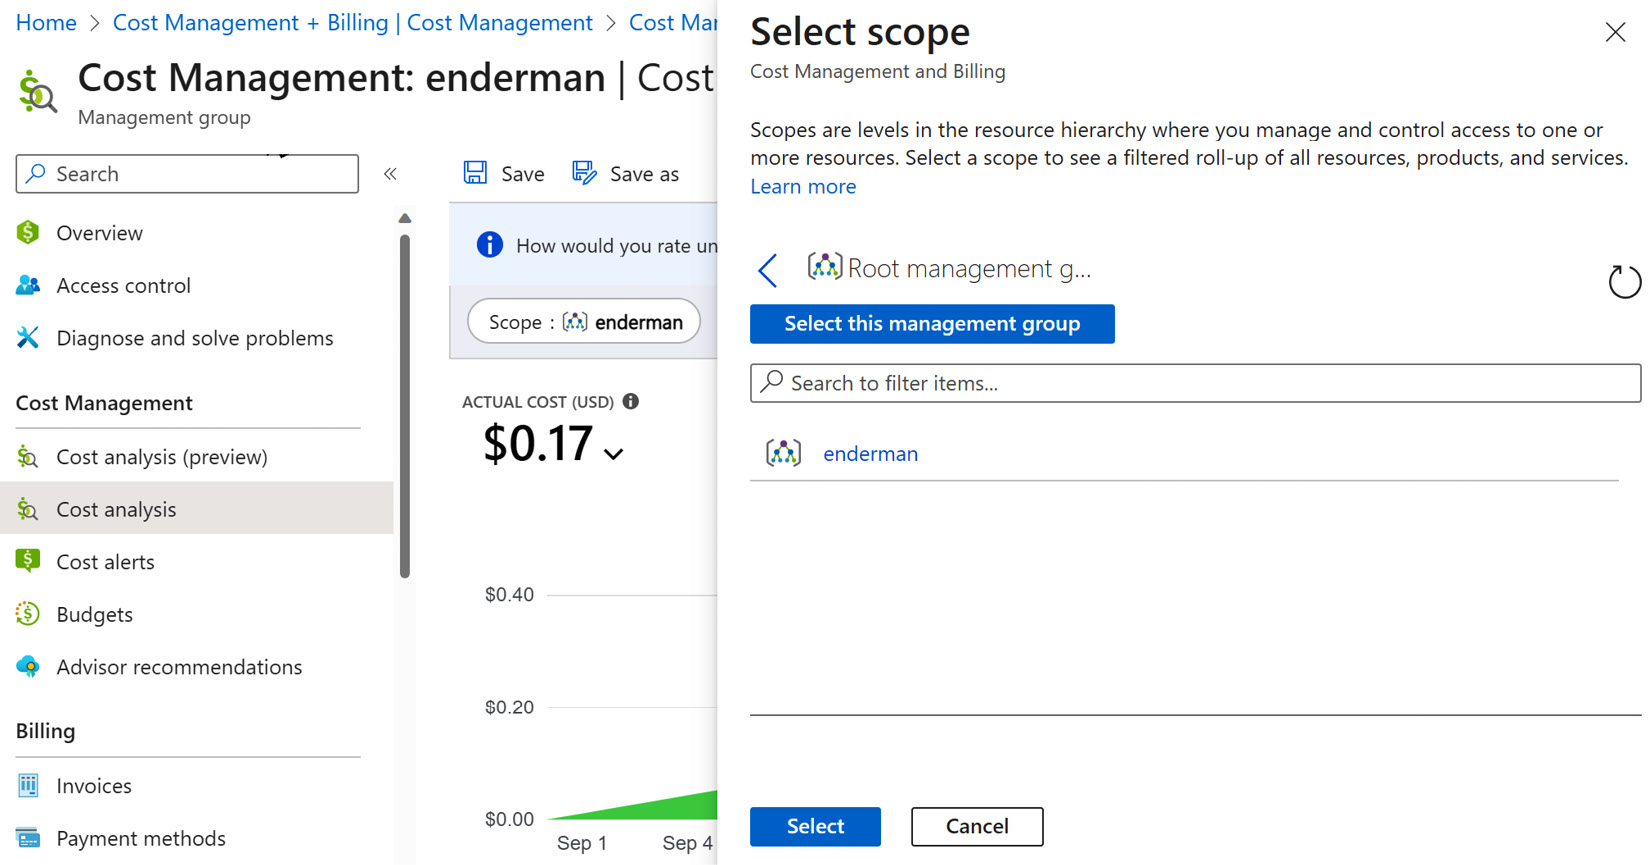
Figure 1.15 – Child management group
Please note that the aforementioned steps assume you have organized your subscriptions into management groups according to the Microsoft WAF guidance. More details are available at https://docs.microsoft.com/en-us/learn/modules/enterprise-scale-introduction/3-enterprise-scale-architecture-approach.
Cost grouped by tag
As you have seen previously, in Azure, you can use resource tags to allocate costs. After careful planning, your team has set up appropriate tags for the workload. In this example, the env:dev or env:prod tag has been applied to each resource in the dev and prod subscriptions for the marketing website’s workload. Now, for the annual budget planning, the finance team is asking you to provide costs for the dev and production environments. Here is how you can accomplish this task:
- Open Cost Management + Billing in the Azure portal and then click on Cost Analysis.
- Click on the Group by dropdown, then select Tag as a filter. Next, select a given tag to group by the cost. In this case, I have selected the env tag, which contains values such as dev and prod.
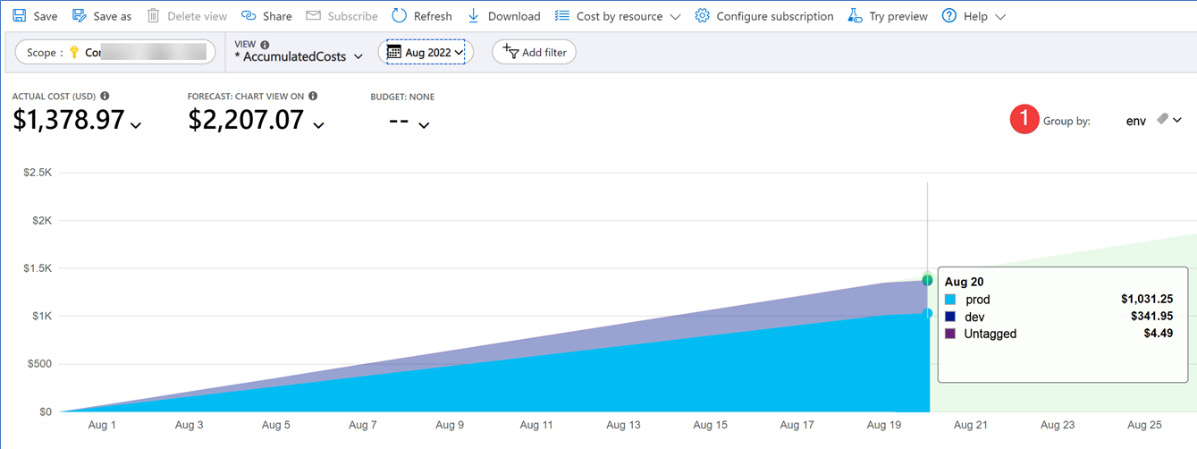
Figure 1.16 – Cost grouped by the env tag
Note that when you group the cost by tag, you will see the Untagged category. This is because there are untagged resources in your subscription. Later, we will discuss how to deal with untagged and untaggable resources since, practically, it is not possible to tag 100% of resources all the time.
Creating, saving, and sharing custom cost analysis views
Finally, you want to create custom views and share them with the FinOps team to standardize the cost showback across teams. You can create private views that only you can see, as well as shared views. Shared views are accessible to anyone who has cost management access. To edit or delete a shared view, you will need cost management contributor access.
The finance team is asking for a standardized report that shows quarterly spending by service in the Azure US West 2 region for showback purposes. This is how you can accomplish the task:
- Open Cost Management + Billing in the Azure portal and then click on Cost Analysis.
- Click on the VIEW dropdown and select CostByService.
- Change Time Range to This Quarter.
- Click on Add filter, then select Location from the drop-down list. For Value, select US West 2. For Chart Type, select Column (stacked).
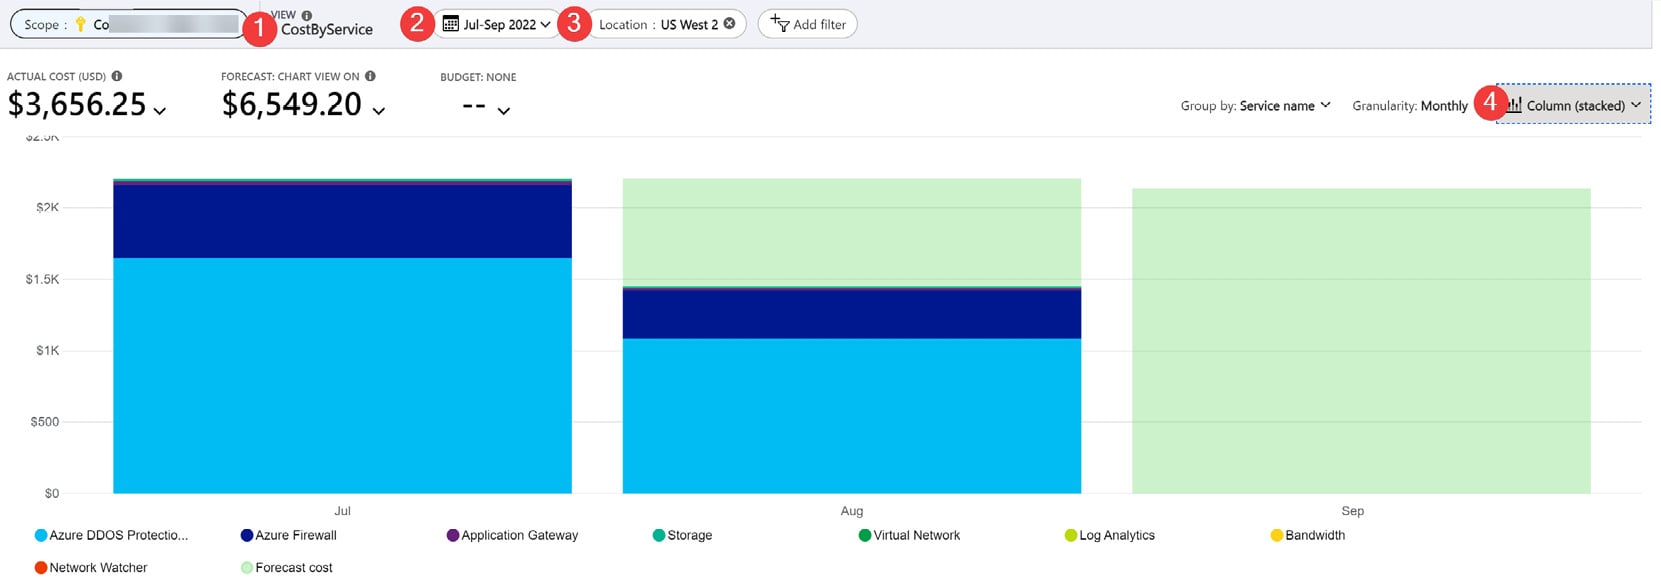
Figure 1.17 – Cost by services custom view
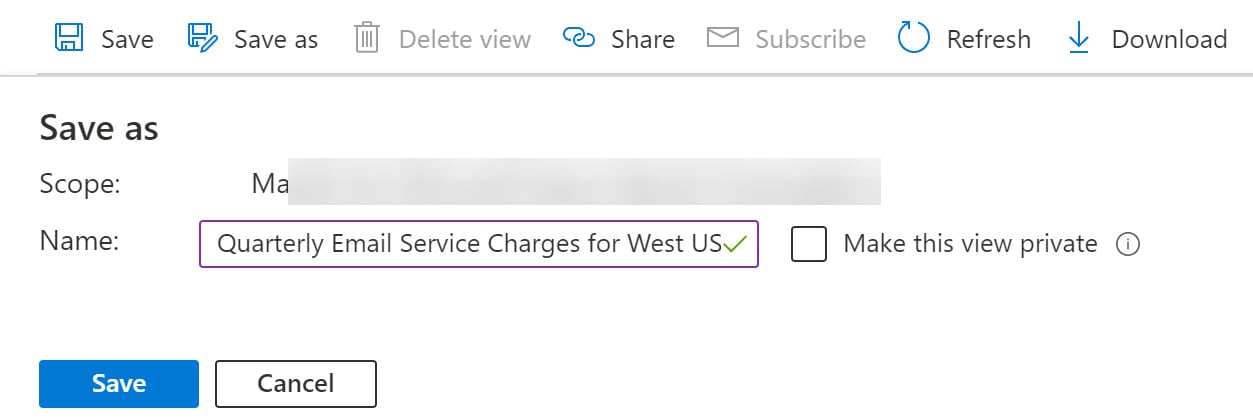
Figure 1.18 – Save the custom dashboard
- To share the view via a direct URL, click on Share.
The shared views will then appear under the VIEW dropdown of the Cost Analysis page. That concludes this chapter. Let’s recap what we’ve learned so far.