

Next we will use the second Excel spreadsheet available from your Packt account:
CHData-Nov.xls.
Note
There are two sample data Excel spreadsheets (available for download from your account at http://www.PacktPub.com) that are used in the first chapter. Their names are CHData_Oct.xls and CHData-Nov.xls.
To load more than one spreadsheet or to load from a different data source, we must edit the load script. The Edit Script dialog is opened from the File menu or by clicking on the Edit Script symbol in the toolbar.
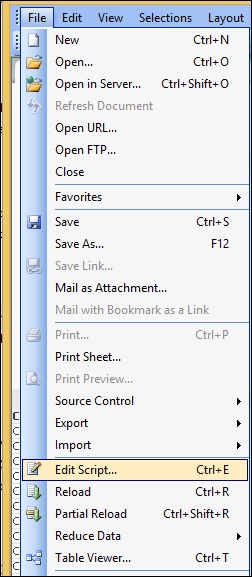
Figure 1-4: A closeup of the File menu showing Edit Script
From the Edit Script interface, we can modify and execute a script that connects the QlikView document to an ODBC data source (or to data files of different types) and also pulls in the data source information.
Our first script was generated automatically; but scripts can be typed manually, or automatically generated scripts can be modified. Complex script statements must, at least partially, be entered manually. The statements, expressions, functions, and so on available for the creation of scripts are described in the QlikView Help: Script Syntax and Script Expressions.
The Edit Script dialog uses autocomplete so, when you type, the program tries to predict what is required in the script without you having to type it completely. The predictions include words that are part of the script syntax. The script is also color-coded by syntax components. The Edit Script interface and behavior can be customized by choosing Tools and Editor Preferences.
At the top of the dialog, a menu bar, with various script-related commands, is found. The most frequently used commands also appear in the toolbar. In the toolbar, there is also a drop-down list for the tabs of the Edit Script wizard.
Note
Make sure your Excel column headers aren't named the same if you are going to use them as labels. If the columns are named the same, QlikView automatically tries to combine them!
Once we have clicked on the Edit Script menu item, we will see the following script in the script interface:
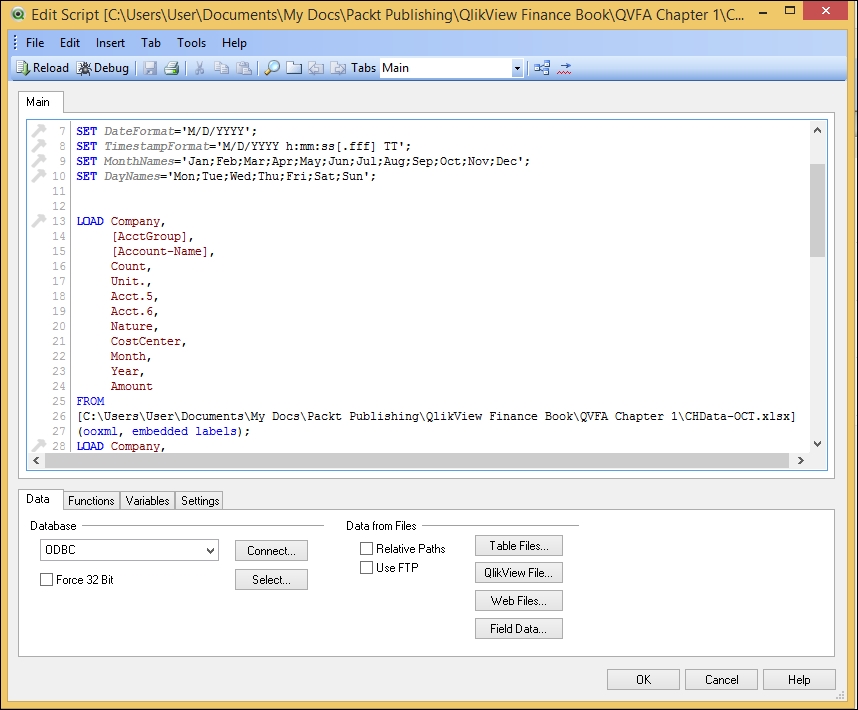
Figure 1-5: The Edit Script interface with our generated script
The script in the Edit Script interface is the automatically generated one that was created by the wizard when we started this QlikView file. The automatically generated script picked up the column names from the Excel file and put in some default formatting scripting. The actual text of the script is as follows:
SET DateFormat='M/D/YYYY';
SET TimestampFormat='M/D/YYYY h:mm:ss[.fff] TT';
SET MonthNames='Jan;Feb;Mar;Apr;May;Jun;Jul;Aug;Sep;Oct;Nov;Dec';
SET DayNames='Mon;Tue;Wed;Thu;Fri;Sat;Sun';

LOAD Company,
     [AcctGroup],
     [Account-Name],
     Count,
     Unit.,
     Acct.5,
     Acct.6,
     Nature,
     CostCenter,
     Month,
     Year,
     Amount
FROM
[C:\Users\User\Documents\My Docs\Packt Publishing\QlikView Finance Book\QVFA Chapter 1\CHData-OCT.xlsx]
(ooxml, embedded labels);
We can change our date formats, month names, day names, our thousands, and our decimal separators by changing them in the automatically generated formats. We can copy this part of the script into new blank scripts to get started. The language selection that we made during the initial installation of QlikView determines the defaults assigned to this portion of the script.
We can add data from multiple sources, such as ODBC links, additional Excel tables, sources from the Web, FTP, and even other QlikView files.
Our first Excel file, which we used to create the initial QlikView document, is already in our script. It happened to be October 2013 data, but what if we wanted to add November data to our analysis? We would just go into Edit Script from the File menu and then click on the script itself.
Note
Make sure your cursor is at the bottom of the script after the first Excel file path and description. If you do not position your cursor where you want your additional script information to populate, you could generate your new script code in the middle of your existing script code. If you make a mistake, click on CANCEL and start over.
After navigating to the script location where you want to add your new code, click on the Table Files button below the script and toward the center-right—the first button in the column. Click on NEXT through the next four screens unless you need to add column labels or transform your data for analysis in some way. The following section is added to our script:
LOAD Company,
     [AcctGroup],
     [Account-Name],
     Count,
     Unit.,
     Acct.5,
     Acct.6,
     Nature,
     CostCenter,
     Month,
     Year,
     Amount
FROM
[C:\Users\User\Documents\My Docs\Packt Publishing\QlikView Finance Book\QVFA Chapter 1\CHData-NOV.xlsx](ooxml, embedded labels, table is LNData);
Comments can be added to scripts using // for a single line or by surrounding the comment by a beginning /* and an ending */; they show up in green. After using the OK button to get out of the Edit Script interface, there is another File menu item that can be used to see whether QlikView has correctly interpreted the joins. This is the Table Viewer menu item. You cannot edit in the Table view, but it is convenient to visualize how the table fields are interacting.
Tell the Edit Script interface OK by clicking on the OK button in the lower-right corner. This will save the changes to the script. Now, using the File menu, navigate below Edit Script to the RELOAD menu item, and click on that to reload your data. If you receive any error messages, the solutions can be researched in the QlikView Help. In this case, QlikView knew that we were adding data to the same table, the layout was the same, and the column names were the same. But looking at company List Box and Amount Statistics Box, we see everything added together. The following screenshot shows this:
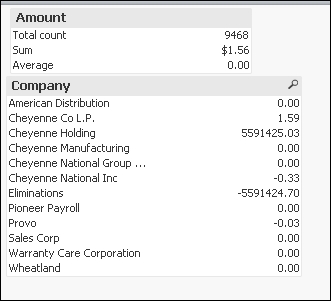
Figure 1-6: Data doubled after the reload with the additional file
The reason why this is happening is that we do not have a selection to split the months and only select October or November or to split October from November. What do we do? Now that we have more than one month of data, we can add another List Box with Months. This will automatically link up with our Chart and Straight Table sheet objects to separate our monthly data.
First, we will add a new List Box for Months. Right-click on the sheet and select New Sheet Object | List Box. In the General tab, we will choose Field (labeled Month in the Excel files). Then, we go to the Sort tab and check Sort by Text. Finally, we choose the icons that we want to appear on the top bar of List Box in the Captions tab.
When we choose OCTOBER or NOVEMBER, our sheet objects automatically show the correct sum of the individual months. Your QlikView document will now look somewhat similar to this next screenshot, depending on how you arranged your added sheet objects:
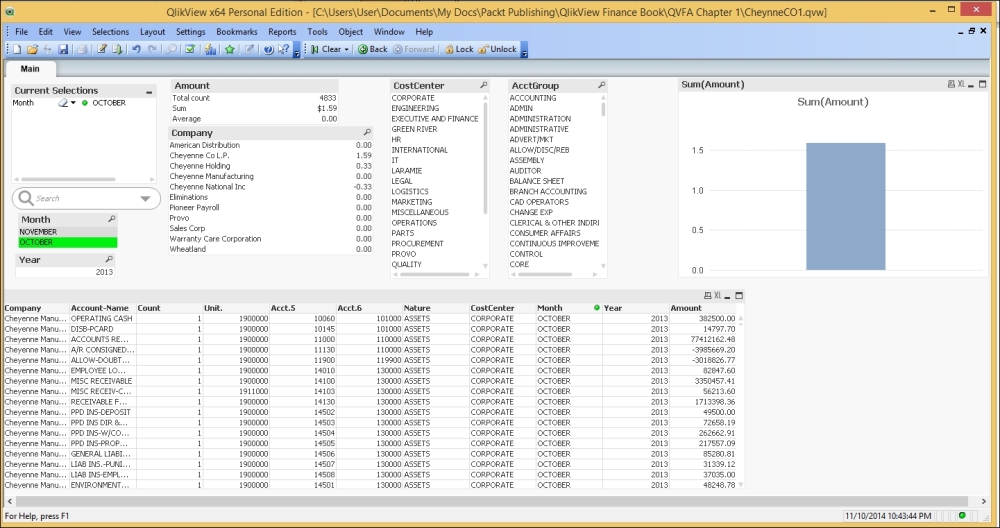
Figure 1-7: A QlikView document