

When we wanted to visualize word embedding in Chapter 3, Word2vec – Learning Word Embeddings, we manually implemented the visualization with the t-SNE algorithm. However, you also could use TensorBoard for visualizing word embeddings. TensorBoard is a visualization tool provided with TensorFlow. You can use TensorBoard to visualize the TensorFlow variables in your program. This allows you to see how various variables behave over time (for example, model loss/accuracy), so you can identify potential issues in your model.
TensorBoard enables you to visualize scalar values and vectors as histograms. Apart from this, TensorBoard also allows you to visualize word embeddings. Therefore, it takes all the required code implementation away from you, if you need to analyze what the embeddings look like. Next we will see how we can use TensorBoard to visualize word embeddings. The code for this exercise is provided in tensorboard_word_embeddings.ipynb in the appendix folder.
First, we will list the steps for starting TensorBoard. TensorBoard acts as a service and runs on a specific port (by default, on 6006). To start TensorBoard, you will need to follow the following steps:
Open up Command Prompt (Windows) or Terminal (Ubuntu/macOS).
Go into the project home directory.
If you are using
pythonvirtuanenv, activate the virtual environment where you have installed TensorFlow.Make sure that you can see the TensorFlow library through Python. To do this, follow these steps:
Type in
python3, you will get a>>>looking promptTry
import tensorflow as tfIf you can run this successfully, you are fine
Exit the
pythonprompt (that is,>>>) by typingexit()
Type in
tensorboard --logdir=models:The
--logdiroption points to the directory where you will create data to visualizeOptionally, you can use
--port=<port_you_like>to change the port TensorBoard runs on
You should now get the following message:
TensorBoard 1.6.0 at <url>;:6006 (Press CTRL+C to quit)Enter the
<url>:6006in to the web browser. You should be able to see an orange dashboard at this point. You won't have anything to display because we haven't generated data.
First, we will download and load the 50-dimensional GloVe embeddings we used in Chapter 9, Applications of LSTM – Image Caption Generation. For that first download the GloVe embedding file (glove.6B.zip) from https://nlp.stanford.edu/projects/glove/ and place it in the appendix folder. We will load the first 50,000 word vectors in the file and later use these to initialize a TensorFlow variable. We will also record the word strings of each word, as we will later provide these as labels for each point to display on TensorBoard:
vocabulary_size = 50000
pret_embeddings = np.empty(shape=(vocabulary_size,50),dtype=np.float32)

words = []

word_idx = 0
with zipfile.ZipFile('glove.6B.zip') as glovezip:
    with glovezip.open('glove.6B.50d.txt') as glovefile:
        for li, line in enumerate(glovefile):
            if (li+1)%10000==0: print('.',end='')
            line_tokens = line.decode('utf-8').split(' ')
            word = line_tokens[0]

            vector = [float(v) for v in line_tokens[1:]]
            assert len(vector)==50
            words.append(word)
            pret_embeddings[word_idx,:] = np.array(vector)
            word_idx += 1
            if word_idx == vocabulary_size:
                break
Now, we will define TensorFlow-related variables and operations. Before this, we will create a directory called models, which will be used to store the variables:
log_dir = 'models'

if not os.path.exists(log_dir):
    os.mkdir(log_dir)
Then, we will define a variable that will be initialized with the word embeddings we copied from the text file earlier:
embeddings = tf.get_variable('embeddings',shape=[vocabulary_size, 50],
                             initializer=tf.constant_initializer(pret_embeddings))
We will next create a session and initialize the variable we defined earlier:
session = tf.InteractiveSession()
tf.global_variables_initializer().run()
Thereafter, we will create a tf.train.Saver object. The Saver object can be used to save TensorFlow variables to the memory, so that they can later be restored if needed. In the following code, we will save the embedding variable to the models directory under the name, model.ckpt:
saver = tf.train.Saver({'embeddings':embeddings})
saver.save(session, os.path.join(log_dir, "model.ckpt"), 0)
We also need to save a metadata file. A metadata file contains labels/images or other types of information associated with the word embeddings, so that when you hover over the embedding visualization the corresponding points will show the word/label they represent. The metadata file should be of the .tsv (tab separated values) format and should contain vocabulary_size + 1 rows in it, where the first row contains the headers for the information you are including. In the following code, we will save two pieces of information: word strings and a unique identifier (that is, row index) for each word:
with open(os.path.join(log_dir,'metadata.tsv'), 'w',encoding='utf-8') as csvfile:
    writer = csv.writer(csvfile, delimiter='\t',
                            quotechar='|', quoting=csv.QUOTE_MINIMAL)
    writer.writerow(['Word','Word ID'])
    for wi,w in enumerate(words):
      writer.writerow([w,wi])
Then, we will need to tell TensorFlow where it can find the metadata for the embedding data we saved to the disk. For this, we need to create a ProjectorConfig object, which maintains various configuration details about the embedding we want to display. The details stored in the ProjectorConfig folder will be saved to a file called projector_config.pbtxt in the models directory:
config = projector.ProjectorConfig()
Here, we will populate the required fields of the ProjectorConfig object we created. First, we will tell it the name of the variable we're interested in visualizing. Next, we will tell it where it can find the metadata corresponding to that variable:
embedding_config = config.embeddings.add()
embedding_config.tensor_name = embeddings.name
embedding_config.metadata_path = 'metadata.tsv'
We will now use a summary writer to write this to the projector_config.pbtxt file. TensorBoard will read this file at startup:
summary_writer = tf.summary.FileWriter(log_dir)
projector.visualize_embeddings(summary_writer, config)
Now if you load TensorBoard, you should see something similar to Figure A.3:
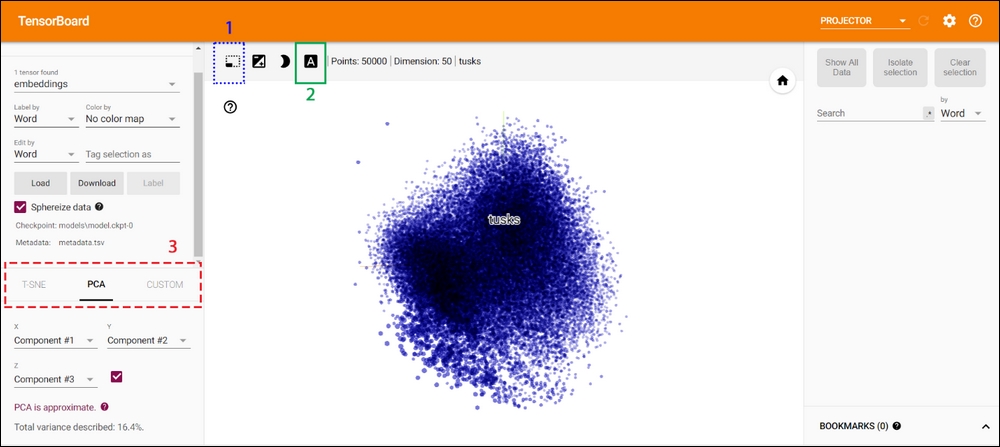
Figure A.3: Tensorboard view of the embeddings
When you hover over the displayed point cloud, it will show the label of the word you're currently hovering over, as we provided this information in the metadata.tsv file. Furthermore, you have several options. The first option (shown with a dotted line and marked as 1) will allow you to select a subset of the full embedding space. You can draw a bounding box over the area of the embedding space you're interested in, and it will look as shown in Figure A.4. I have selected the embeddings at the bottom right corner:
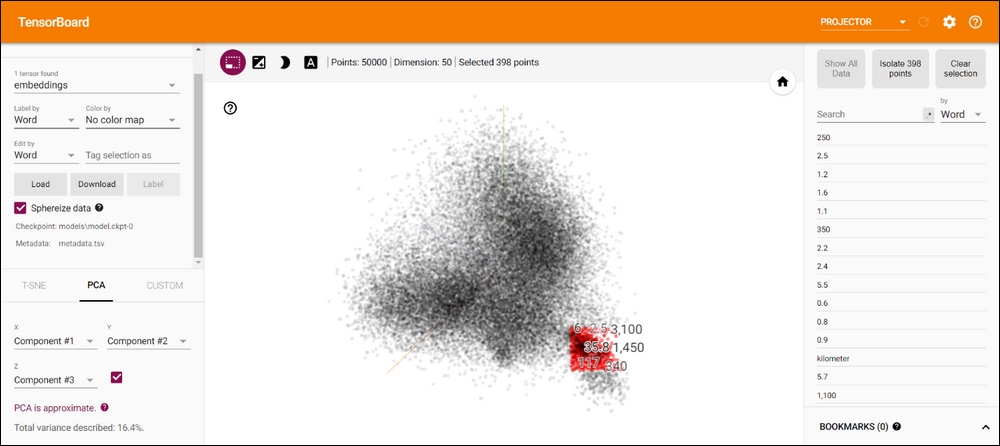
Figure A.4: Selecting a subset of the embedding space
Another option you have is the ability to view words themselves, instead of dots. You can do this by selecting the second option in Figure A.3 (show inside a solid box and marked as 2). This would look as shown in Figure A.5. Additionally, you can pan/zoom/rotate the view to your liking. If you click on the help button (shown within a solid box and marked as 1 in Figure A.5), it will show you a guide for controlling the view:
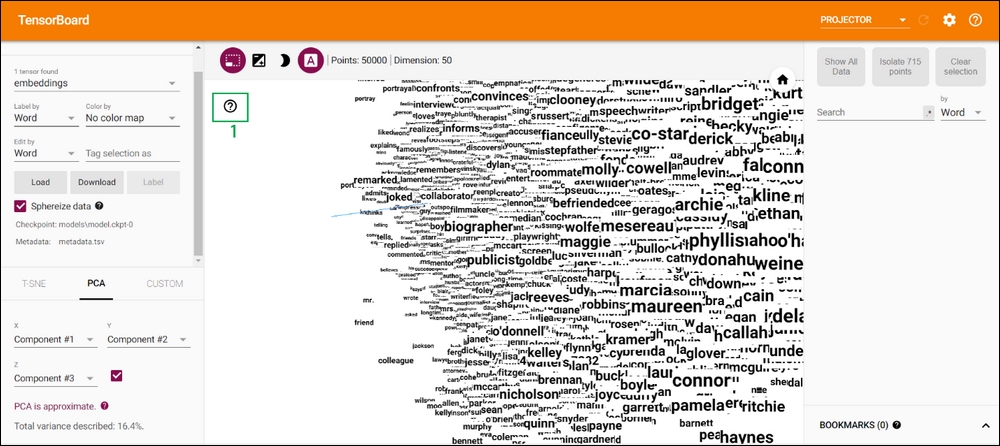
Figure A.5: Embedding vectors displayed as words instead of dots
Finally, you can change the visualization algorithm from the panel on the left-hand side (shown with a dashed line and marked with 3 in Figure A.3).