Book Image

Hands-On Data Science with Anaconda

By : Yuxing Yan, James Yan
Book Image

Hands-On Data Science with Anaconda

By: Yuxing Yan, James Yan

Overview of this book

Anaconda is an open source platform that brings together the best tools for data science professionals with more than 100 popular packages supporting Python, Scala, and R languages. Hands-On Data Science with Anaconda gets you started with Anaconda and demonstrates how you can use it to perform data science operations in the real world. The book begins with setting up the environment for Anaconda platform in order to make it accessible for tools and frameworks such as Jupyter, pandas, matplotlib, Python, R, Julia, and more. You’ll walk through package manager Conda, through which you can automatically manage all packages including cross-language dependencies, and work across Linux, macOS, and Windows. You’ll explore all the essentials of data science and linear algebra to perform data science tasks using packages such as SciPy, contrastive, scikit-learn, Rattle, and Rmixmod. Once you’re accustomed to all this, you’ll start with operations in data science such as cleaning, sorting, and data classification. You’ll move on to learning how to perform tasks such as clustering, regression, prediction, and building machine learning models and optimizing them. In addition to this, you’ll learn how to visualize data using the packages available for Julia, Python, and R.
Table of Contents (15 chapters)

Introducing Spyder

In the Anaconda3 menu, the last entry is Spyder. After clicking it, we can launch Spyder, shown here:

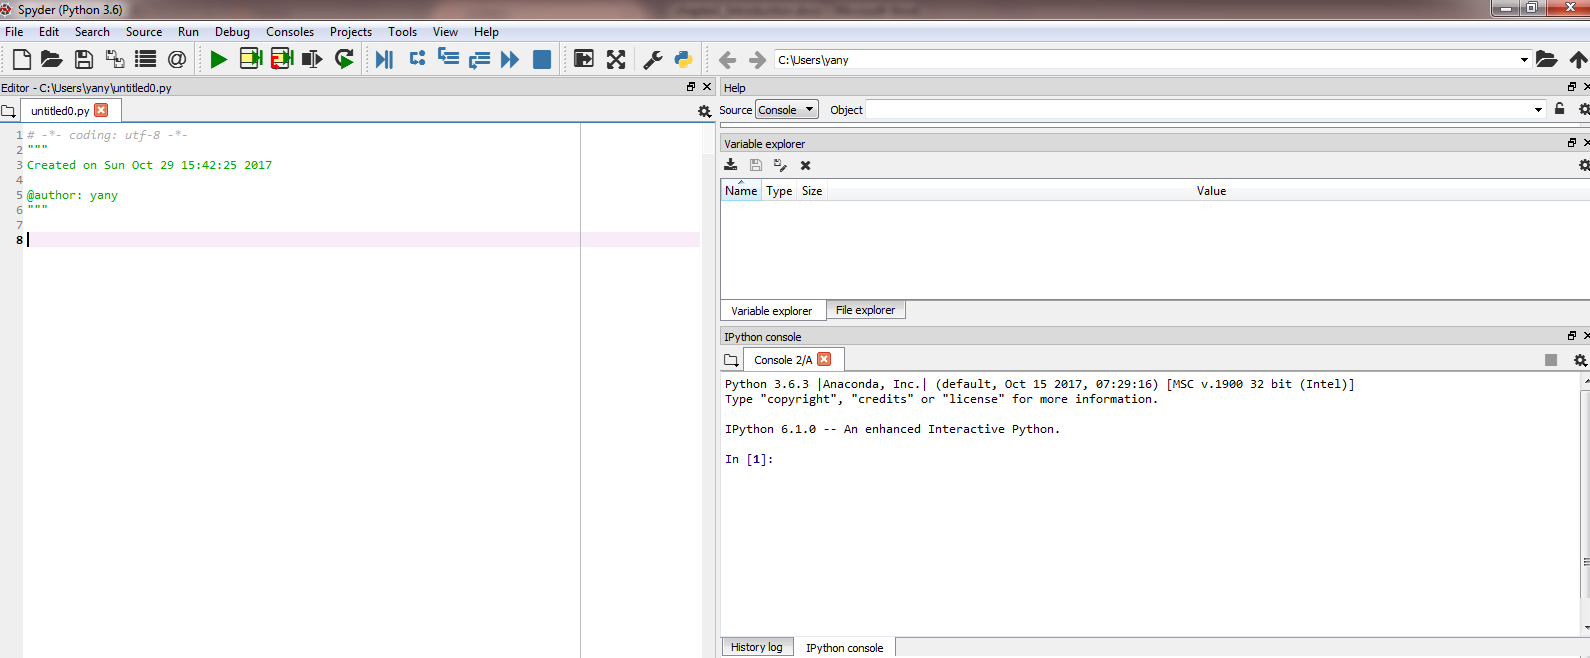
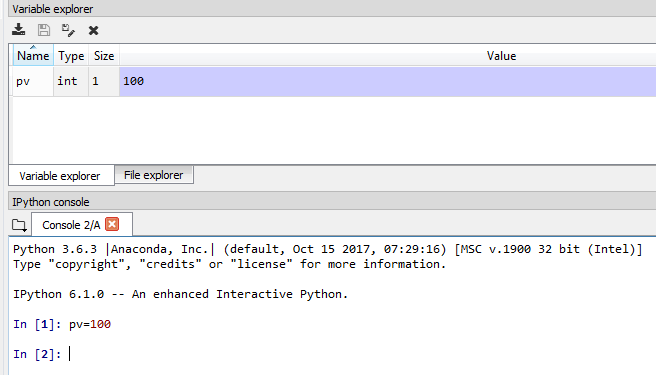
The preceding screenshot shows three panels. The left panel is for writing and editing our programs, the bottom-right panel is for command lines (we could type simple commands there), and the top-right panel is for our variables. For example, after we type pv=100, it would show the variable name, type, size, and value, as shown here:

We could also write our Python program, and debug and run them via the top-left panel. For example, we could run a program with pv_f() function to estimate the present value of one future cash flow, shown here:

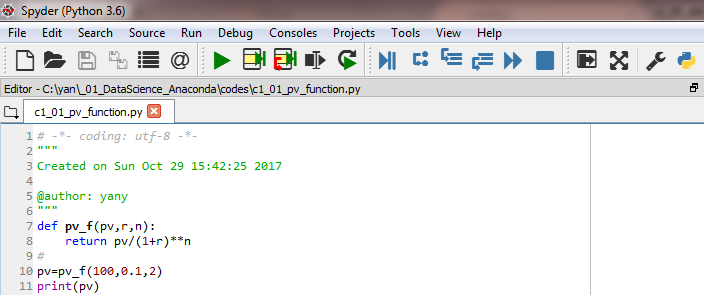
In the preceding screenshot, the green play button is for running the whole Python program, while the second green-yellow one is for partially running it. This feature makes our debugging efforts a little easier, which...