
The Data Collector
There may be cases when a performance problem occurs and there is little or no information available to troubleshoot it. For example, you may receive a notification that CPU percentage usage was 100 percent for a few minutes, thus slowing down your application, but by the time you connected to the system to troubleshoot, the problem is already gone. Many times, a specific problem is difficult to reproduce, and the only choice is to enable a trace or some other collection of data and wait until the problem happens again.
This is where proactively collecting performance data is extremely important, and the Data Collector, a feature introduced with SQL Server 2008, can help you to do just that. The Data Collector allows you to collect performance data, which you can use immediately after a performance problem occurs. You only need to know the time the problem occurred and start looking at the collected data around that period.
Explaining the Data Collector would take an entire chapter, if not an entire book. Therefore, this section aims to show you how to get started. You can find more details about the Data Collector by reading the SQL Server documentation or by reading the Microsoft white paper Using Management Data Warehouse for Performance Monitoring by Ken Lassesen.
Configuration
The Data Collector is not enabled by default after you install SQL Server. To configure it, you need to follow a two-step process:
- To configure the first part, expand the Management folder in Management Studio, right-click the Data Collection node, and select Tasks, followed by Configure Management Data Warehouse. This will run the Configure Management Data Warehouse Wizard. Click Next on the Welcome screen. This will take you to the Configure Management Data Warehouse Storage screen, as shown in the following screenshot. This screen allows you to select the database you will use to collect data. Optionally, you can create a new database by selecting the New button:
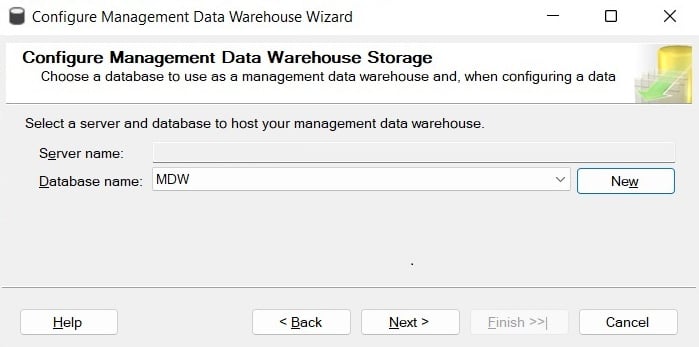
Figure 2.6 – The Configure Management Data Warehouse Storage screen
- Select an existing database, or create a new one, and then click Next. The following screen, Map Logins and Users, as shown in the following screenshot, allows you to map logins and users to management data warehouse roles:
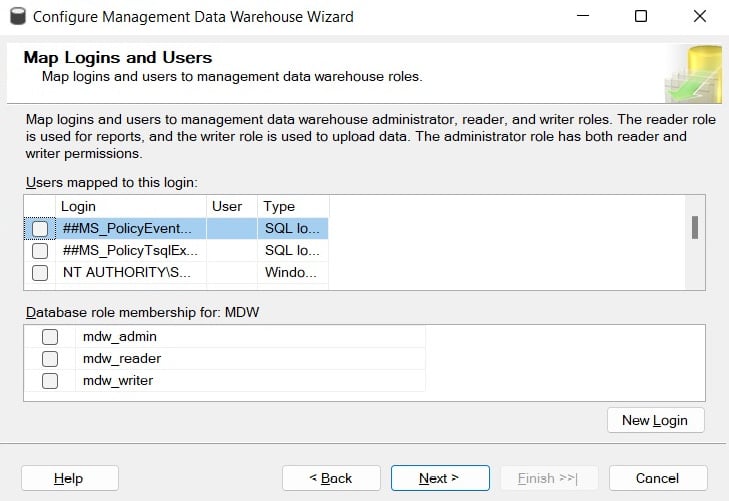
Figure 2.7 – The Map Logins and Users screen
- Click Next. The Complete the Wizard screen will appear.
- On the Complete the Wizard screen, click Finish. You will see the Configure Data Collection Wizard Progress screen. Make sure all the steps shown are executed successfully and click the Close button. This step configures the management data warehouse database, and, among other objects, it will create a collection of tables, some of which we will query directly later in this section.
- To configure the second step, right-click Data Collection again and select Tasks, followed by Configure Data Collection. This will open the Configure Data Collection Wizard screen. Click Next. You should see Setup Data Collection Sets, as shown in the following screenshot:
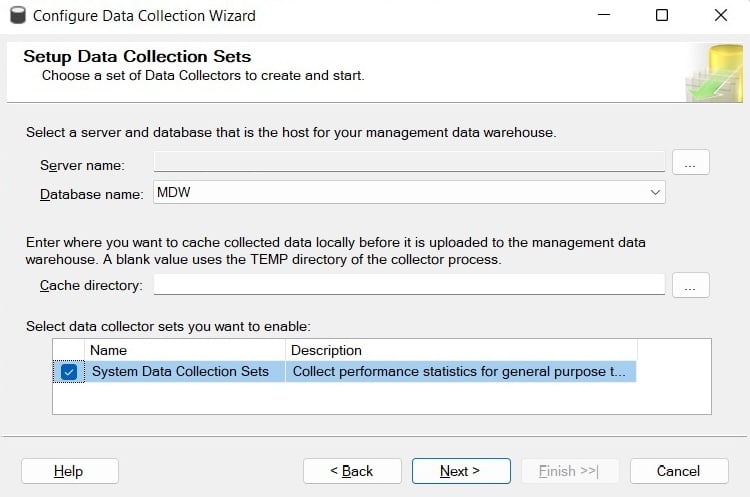
Figure 2.8 – The Setup Data Collection Sets screen
This is where you select the database to be used as the management data warehouse, which is the database you configured in Step 1. You can also configure the cache directory, which is used to collect the data before it is uploaded to the management data warehouse.
- Finally, you need to select the Data Collector sets that you want to enable, which in our case requires selecting System Data Collection Sets. Although it is the only data collector set available on SQL Server 2022, some others have been available on previous versions, such as the Transaction Performance Collection Set, which was used by the In-Memory OLTP feature. Click Next and then Finish on the Complete the Wizard screen.
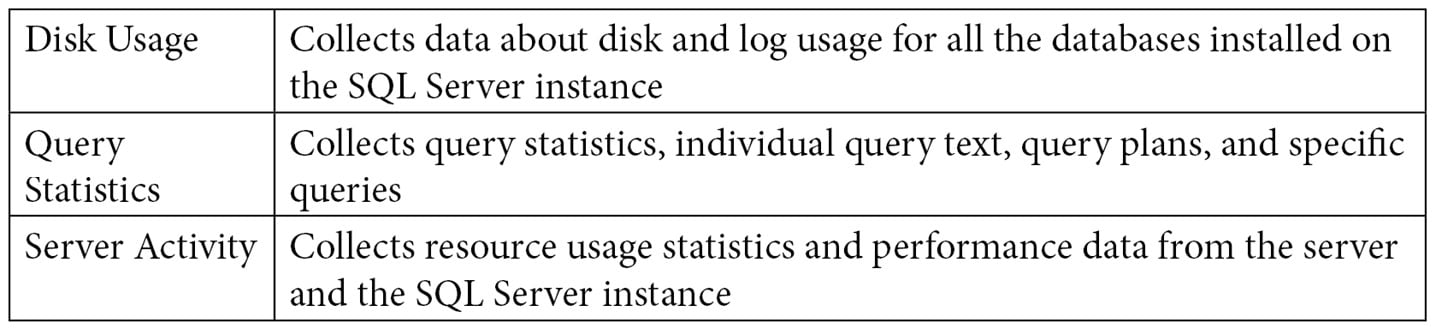
Once you’ve configured the Data Collector, among other items, you will see the three enabled system data collection sets: Disk Usage, Query Statistics, and Server Activity. The Utility Information collection set is disabled by default, and it will not be covered in this book. The following data was collected by the System Data Collection Sets:
In addition, it is strongly recommended that you install the optional Query Hash Statistics collection set, which you can download from http://blogs.msdn.com/b/bartd/archive/2010/11/03/query-hash-statistics-a-query-cost-analysis-tool-now-available-for-download.aspx. The Query Hash Statistics collection set, which unfortunately is not included as part of SQL Server 2022, is based on the query_hash and plan_hash values, as explained earlier in this chapter. It collects historical query and query plan fingerprint statistics, allowing you to easily see the true cumulative cost of the queries in each of your databases. After you install the Query Hash Statistics collection set, you will need to disable the Query Statistics collection set because it collects the same information.
- Finally, you need to be aware of the following SQL Server Agent jobs that were created:
collection_set_1_noncached_collect_and_uploadcollection_set_2_collectioncollection_set_2_uploadcollection_set_3_collectioncollection_set_3_uploadmdw_purge_data_[MDW]syspolicy_purge_history
Using the Data Collector
The next thing you want to do is become familiar with the Data Collector – mostly, the reports available and the information that’s collected on each table. To start looking at the reports, right-click Data Collection and select Reports, Management Data Warehouse, and Server Activity History. Assuming enough data has already been collected, you should see a report similar to the one shown in the following screenshot (only partly shown):
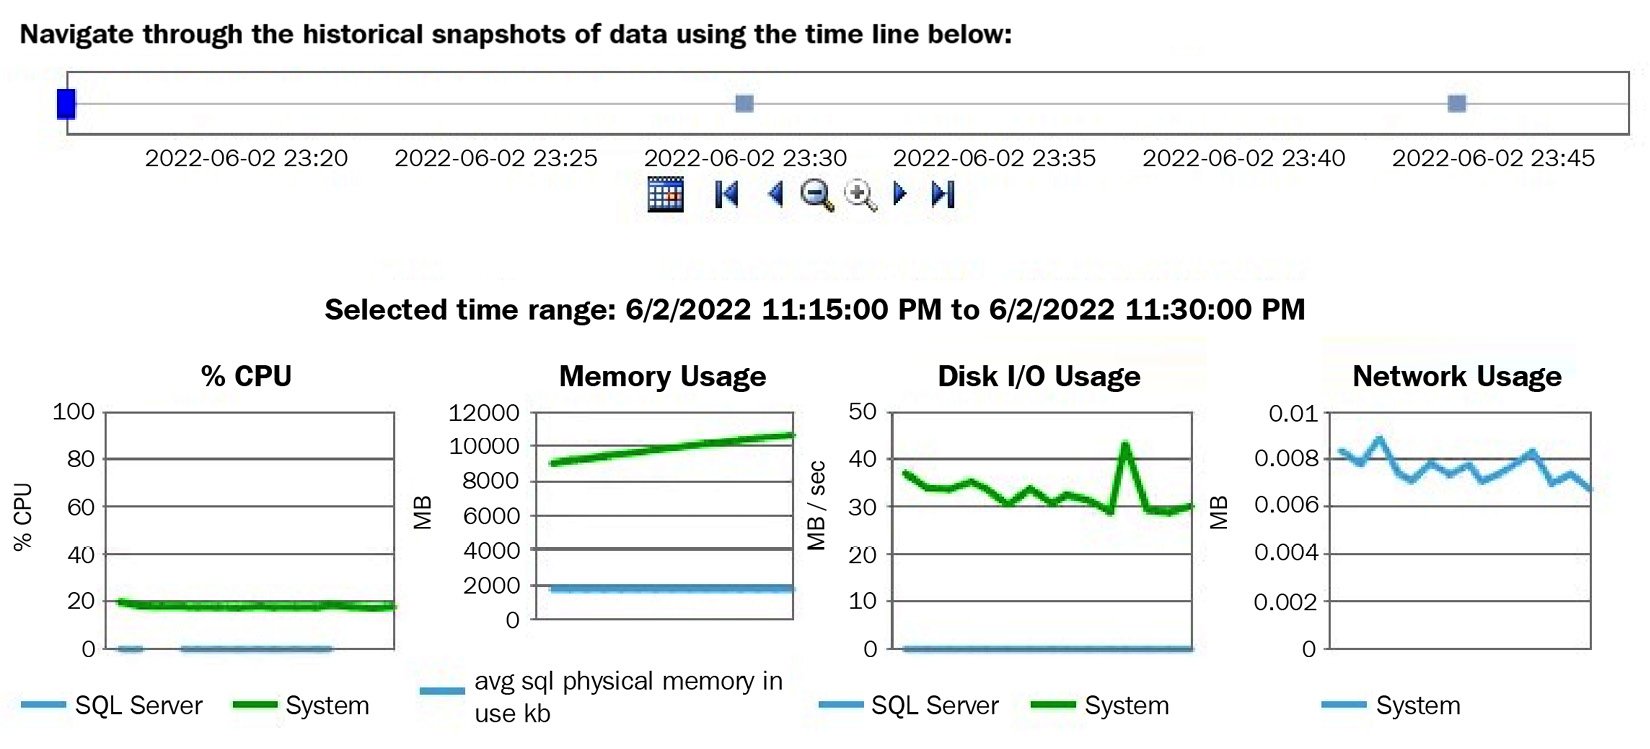
Figure 2.9 – The Server Activity History report
Clicking the SQL Server section of the % CPU graph will take you to the Query Statistics History report. You can also reach this report by right-clicking Data Collection and then selecting Reports, Management Data Warehouse, and Query Statistics History. In both cases, you will end up with the report shown in the following screenshot (only partly shown):
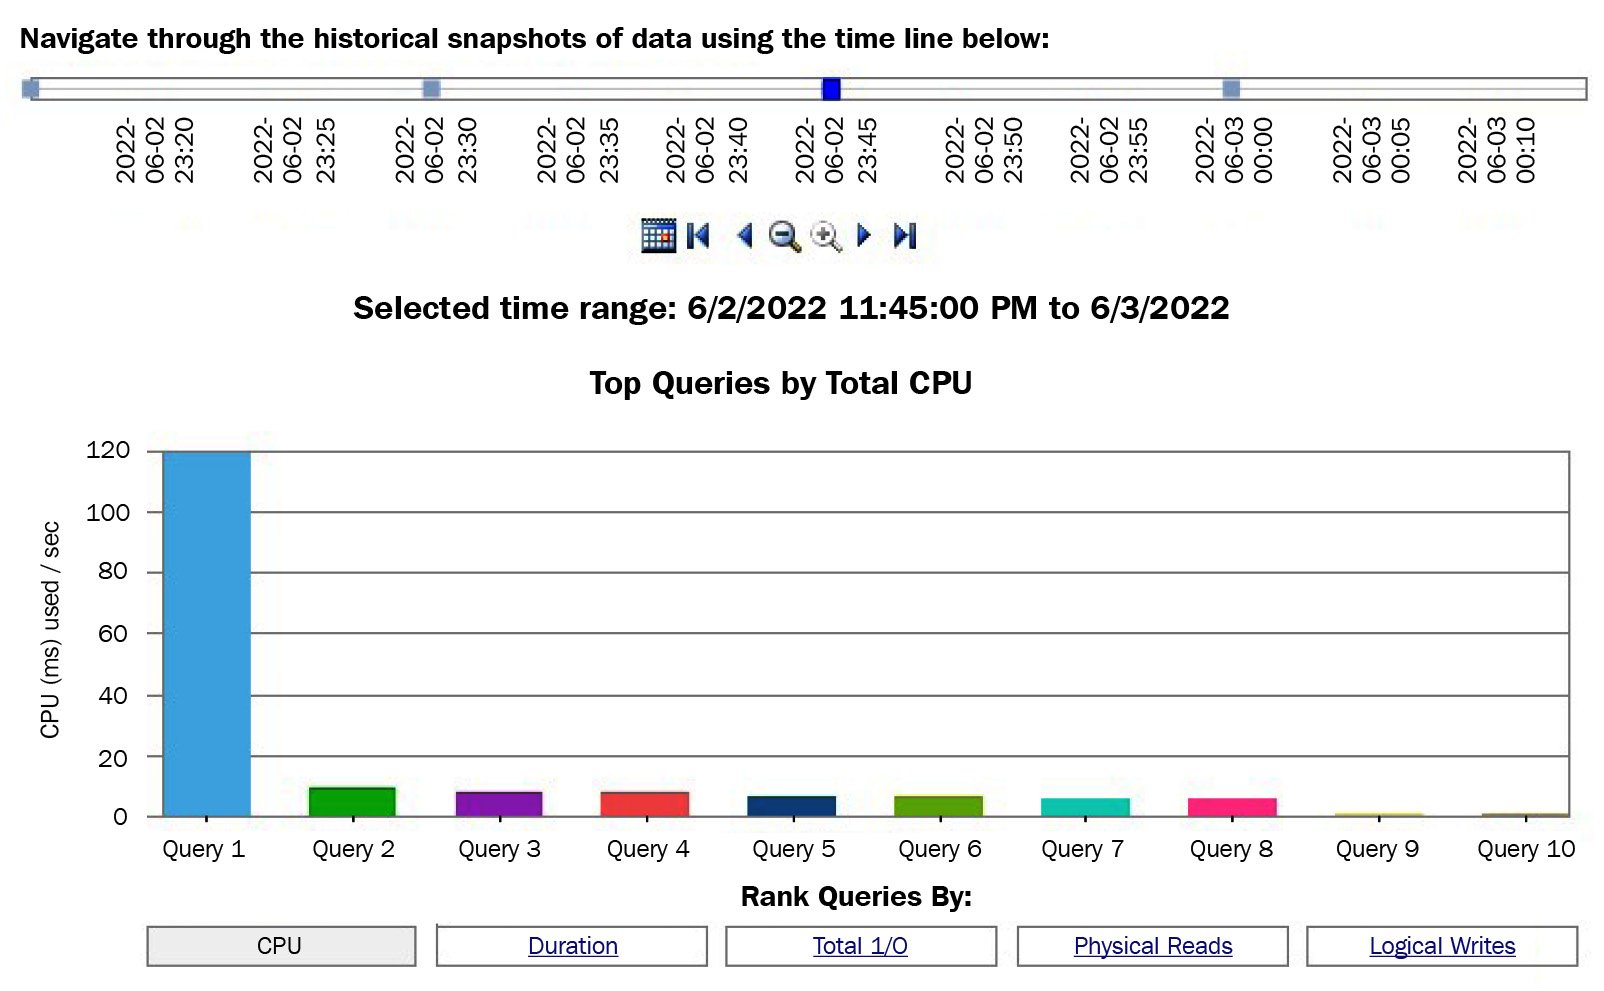
Figure 2.10 – The Query Statistics History report
Running the Query Statistics History report will show you the top 10 most expensive queries ranked by CPU usage, though you also have the choice of selecting the most expensive queries by duration, total I/O, physical reads, and logical writes. The Data Collector includes other reports, and as you’ve seen already, some reports include links to navigate to other reports for more detailed information.
Querying the Data Collector tables
More advanced users will want to query the Data Collector tables directly to create reports or look deeper into the collected data. Creating custom collection sets is also possible and may be required when you need to capture data that the default installation is not collecting. Having custom collection sets would, again, require you to create your own queries and reports.
For example, the Data Collector collects multiple performance counters, which you can see by looking at the properties of the Server Activity collection set. To do this, expand both the Data Collection and System Data Collection sets, right-click the Server Activity collection set, and select Properties. In the Data Collection Set Properties window, select Server Activity – Performance Counters in the Collection Items list box and look at the Input Parameters window. Here is a small sample of these performance counters:
\Memory \% Committed Bytes In Use
\Memory \Available Bytes
\Memory \Cache Bytes
\Memory \Cache Faults/sec
\Memory \Committed Bytes
\Memory \Free & Zero Page List Bytes
\Memory \Modified Page List Bytes
\Memory \Pages/sec
\Memory \Page Reads/sec
\Memory \Page Write/sec
\Memory \Page Faults/sec
\Memory \Pool Nonpaged Bytes
\Memory \Pool Paged Bytes
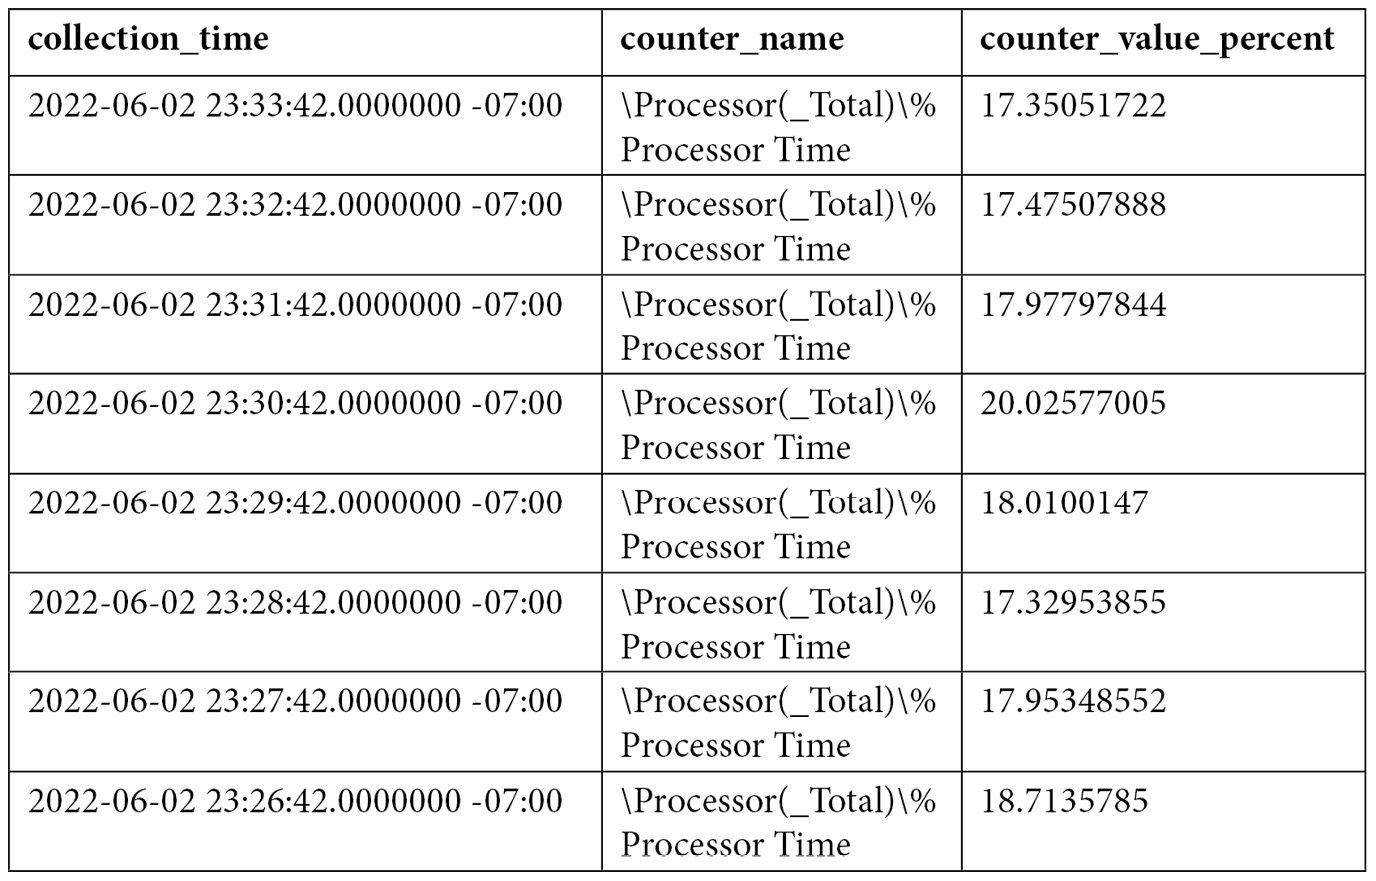
You can also see a very detailed definition of the performance counters that have been collected in your instance by looking at the snapshots.performance_counter_instances table. Performance counters’ data is then stored in the snapshots.performance_counter_values table. One of the most used performance counters by database administrators is '\Processor(_Total)\% Processor Time', which allows you to collect the processor percentage usage. We can use the following query to get the collected data:
SELECT sii.instance_name, collection_time, [path] AS counter_name,
formatted_value AS counter_value_percent
FROM snapshots.performance_counter_values pcv
JOIN snapshots.performance_counter_instances pci
ON pcv.performance_counter_instance_id = pci.performance_counter_id
JOIN core.snapshots_internal si ON pcv.snapshot_id = si.snapshot_id
JOIN core.source_info_internal sii ON sii.source_id = si.source_id
WHERE pci.[path] = '\Processor(_Total)\% Processor Time'
ORDER BY pcv.collection_time desc
An output similar to the following will be shown:
There are some other interesting tables, at least from the point of view of query data collection, you may need to query directly. The Query Statistics collection set uses queries defined in the QueryActivityCollect.dtsx and QueryActivityUpload.dtsx SSIS packages, and the collected data is loaded into the snapshots.query_stats, snapshots.notable_query_text, and snapshots.notable_query_plan tables. These tables collect query statistics, query text, and query plans, respectively. If you installed the Query Hash Statistics collection set, the QueryHashStatsPlanCollect and QueryHashStatsPlanUpload packages will be used instead. Another interesting table is snapshots.active_sessions_and_requests, which collects information about SQL Server sessions and requests.