Book Image

Hands-On Dashboard Development with QlikView

By : Abhishek Agarwal
Book Image

Hands-On Dashboard Development with QlikView

By: Abhishek Agarwal

Overview of this book

QlikView is one of the market leaders when it comes to building effective Business Intelligence solutions. This book will show how you can leverage its power to build your own dashboards to tell your own data story. The book starts with showing you how to connect your data to QlikView and create your own QlikView application. You will learn how to add data from multiple sources, create a data model by joining data, and then review it on the front end. You will work with QlikView components such as charts, list boxes, input boxes, and text objects to create stunning visualizations that help give actionable business insights. You will also learn how to perform analysis on your data in QlikView and master the various types of security measures to be taken in QlikView. By the end of this book, you will have all the essential knowledge required for insightful data storytelling and creating useful BI dashboards using QlikView.
Table of Contents (9 chapters)

Understanding list boxes

In this section, we'll look at the various methods you can employ to select the data in a list box.

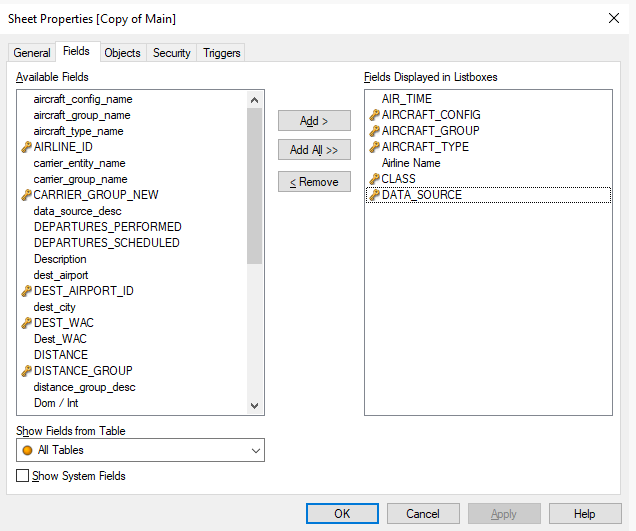
Let's go to the QlikView application and work on list boxes. We will use the data from the previous section and continue using it here. Let's select a few fields to integrate into a list box by holding the Ctrl button and selecting them. Once you have selected them, click Add. All of these filters will be displayed on the right-hand side, as shown in the following screenshot:

Once that is done, we will click on the OK button, which leads us to this dashboard display:

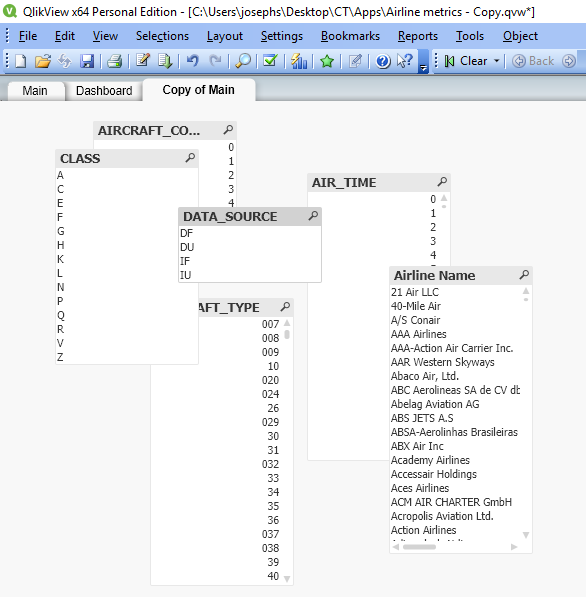
You can manually either drag each list box to the required location, or you can use the Arrange option as well. To do that, you can go into the Layout menu in the toolbar, and click on the Rearrange Sheet Objects option. If you click on that option multiple times, it will...