Book Image

Hands-On Dashboard Development with QlikView

By : Abhishek Agarwal
Book Image

Hands-On Dashboard Development with QlikView

By: Abhishek Agarwal

Overview of this book

QlikView is one of the market leaders when it comes to building effective Business Intelligence solutions. This book will show how you can leverage its power to build your own dashboards to tell your own data story. The book starts with showing you how to connect your data to QlikView and create your own QlikView application. You will learn how to add data from multiple sources, create a data model by joining data, and then review it on the front end. You will work with QlikView components such as charts, list boxes, input boxes, and text objects to create stunning visualizations that help give actionable business insights. You will also learn how to perform analysis on your data in QlikView and master the various types of security measures to be taken in QlikView. By the end of this book, you will have all the essential knowledge required for insightful data storytelling and creating useful BI dashboards using QlikView.
Table of Contents (9 chapters)

Adding dynamic chart displays

In this video, we will look at how we can dynamically hide and show the chart, and we will look at the auto-minimize feature in QlikView.

Let's say you only want to show the pivot chart in the dashboard whenever somebody does a selection of airline name, because then you only want to see the details for that respective airline. So, to do that, you can right-click on the chart, go to Properties, and in the Layout tab, we have a Show section, as seen in the following screenshot:

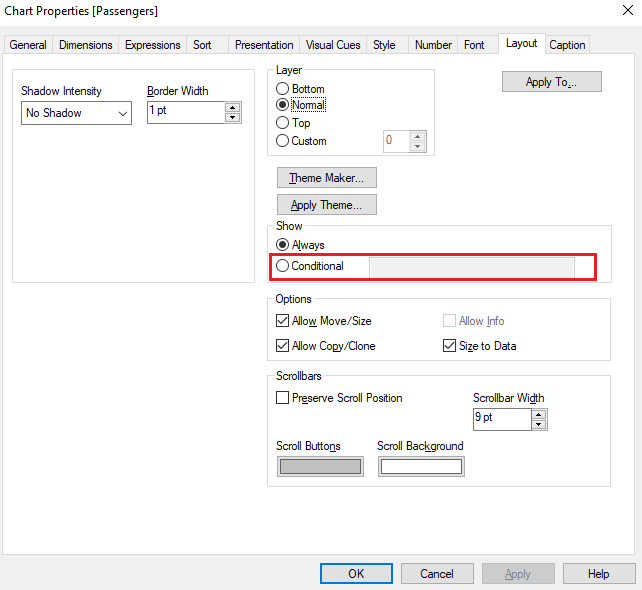
We will enable the Conditional option, and then enter the expression on which we will base the display of the chart. We will use the following expression:

Count(GetFieldSelections([Airline Name]))>0

This counts the field selections for the Airline Name list box, and checks whether it is more than zero. So, if we haven't made any selections in the list box, then...