Book Image

Hands-On Dashboard Development with QlikView

By : Abhishek Agarwal
Book Image

Hands-On Dashboard Development with QlikView

By: Abhishek Agarwal

Overview of this book

QlikView is one of the market leaders when it comes to building effective Business Intelligence solutions. This book will show how you can leverage its power to build your own dashboards to tell your own data story. The book starts with showing you how to connect your data to QlikView and create your own QlikView application. You will learn how to add data from multiple sources, create a data model by joining data, and then review it on the front end. You will work with QlikView components such as charts, list boxes, input boxes, and text objects to create stunning visualizations that help give actionable business insights. You will also learn how to perform analysis on your data in QlikView and master the various types of security measures to be taken in QlikView. By the end of this book, you will have all the essential knowledge required for insightful data storytelling and creating useful BI dashboards using QlikView.
Table of Contents (9 chapters)

List boxes

We have already used list boxes in the previous chapters, and so we have a fair idea of what they do. Now, let's learn about all the properties of list boxes, which you can tweak to make them better suited for your needs.

  1. So, let's go to the QlikView document. To look at various list box properties, let's first go ahead and import, or create, some list boxes. For that, we will right-click on the dashboard, go to New Sheet Object and select the List Box... option there. This will result in the following window:
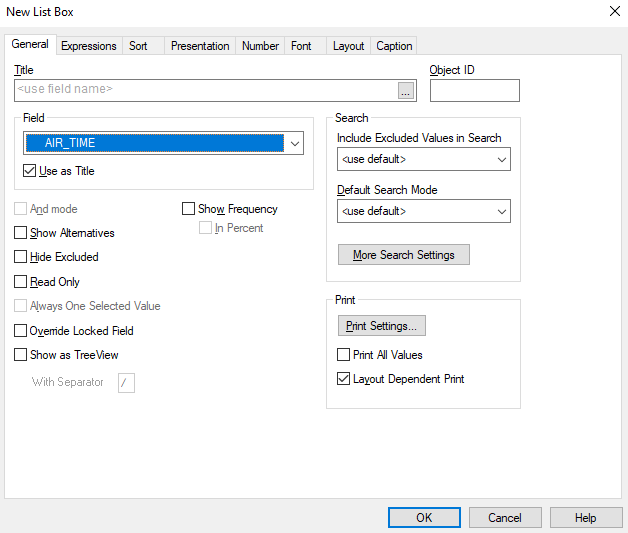
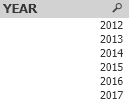
  1. In the Field drop-down menu, we will choose the YEAR field, just as an example, and then click on OK. As a result, the YEAR list box is created on the dashboard, as shown here:
  1. In this way, you will get just one field, but if, let's say, you are interested in adding multiple fields, then you can right-click, go to Select Fields, and...