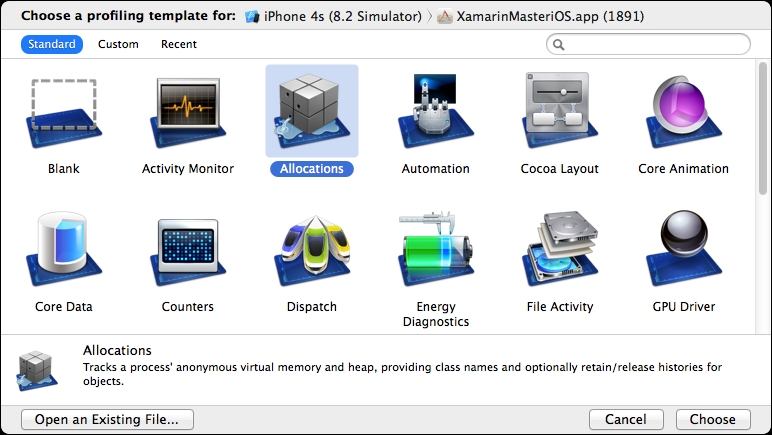
SDKs associated with Xamarin target platforms and development IDEs are equipped with comprehensive analytic tools. Utilizing these tools, developers can identify issues causing app freezes, crashes, slow response time, and other resource-related problems (for example, excessive battery usage).
Xamarin.iOS applications are analyzed using the XCode Instruments toolset. In this toolset, there are a number of profiling templates, each used to analyze a certain perspective of application execution (such as the allocations template that was used in Chapter 2, Memory Management, for memory profiling). Instrument templates can be executed on an application running on the iOS simulator or on an actual device.

Figure 2: XCode Instruments
Similarly, Android applications can be analyzed using the device monitor provided by the Android SDK. Using Android Monitor, memory profile, CPU/GPU utilization, and network usage can also be analyzed, and application-provided diagnostic...


