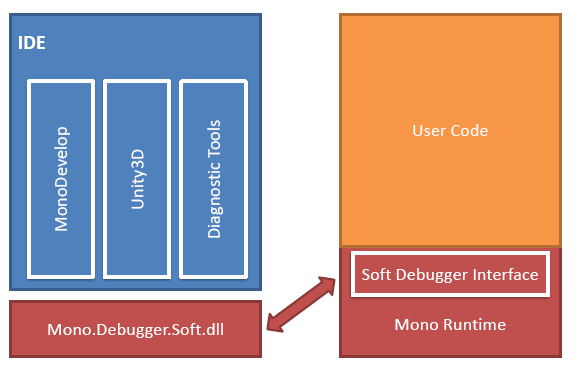
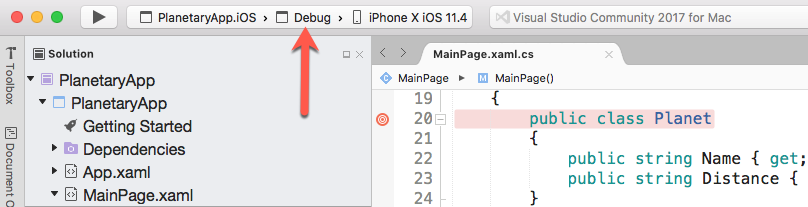
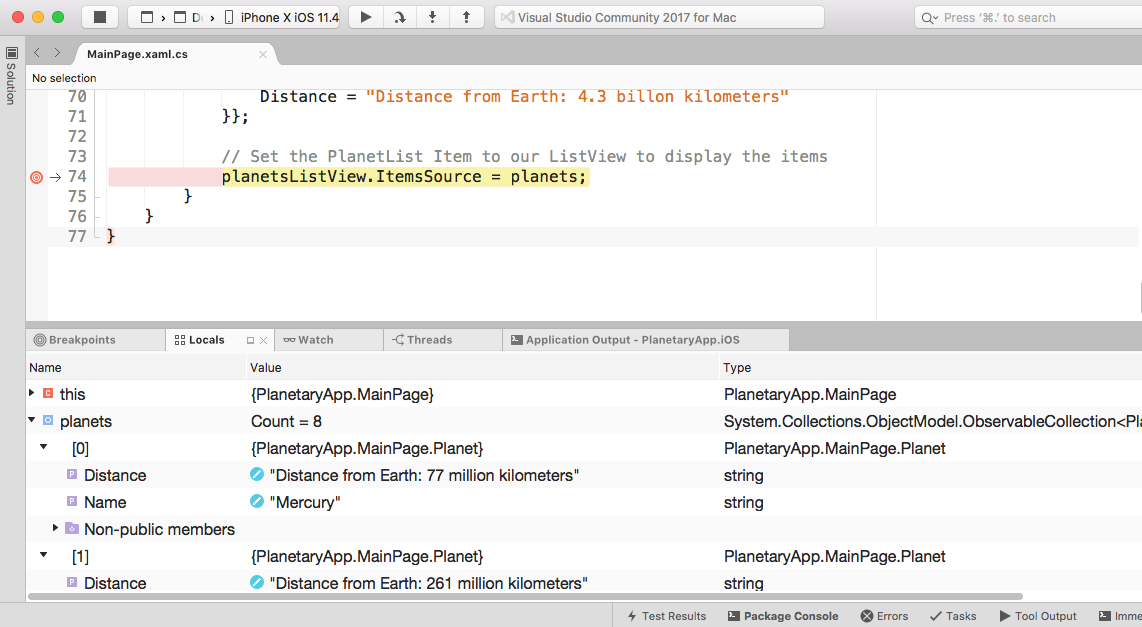
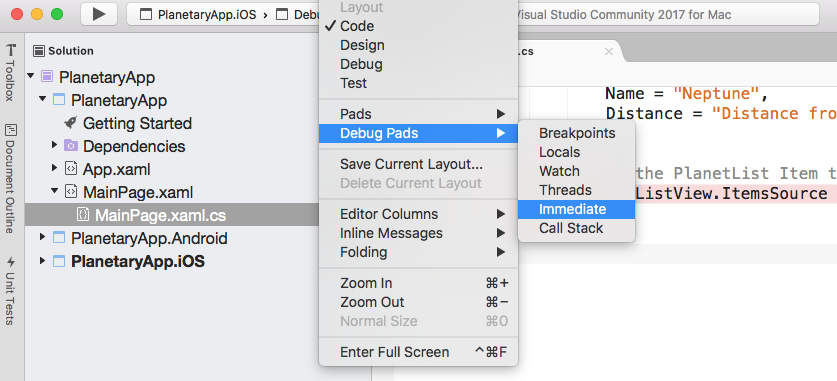
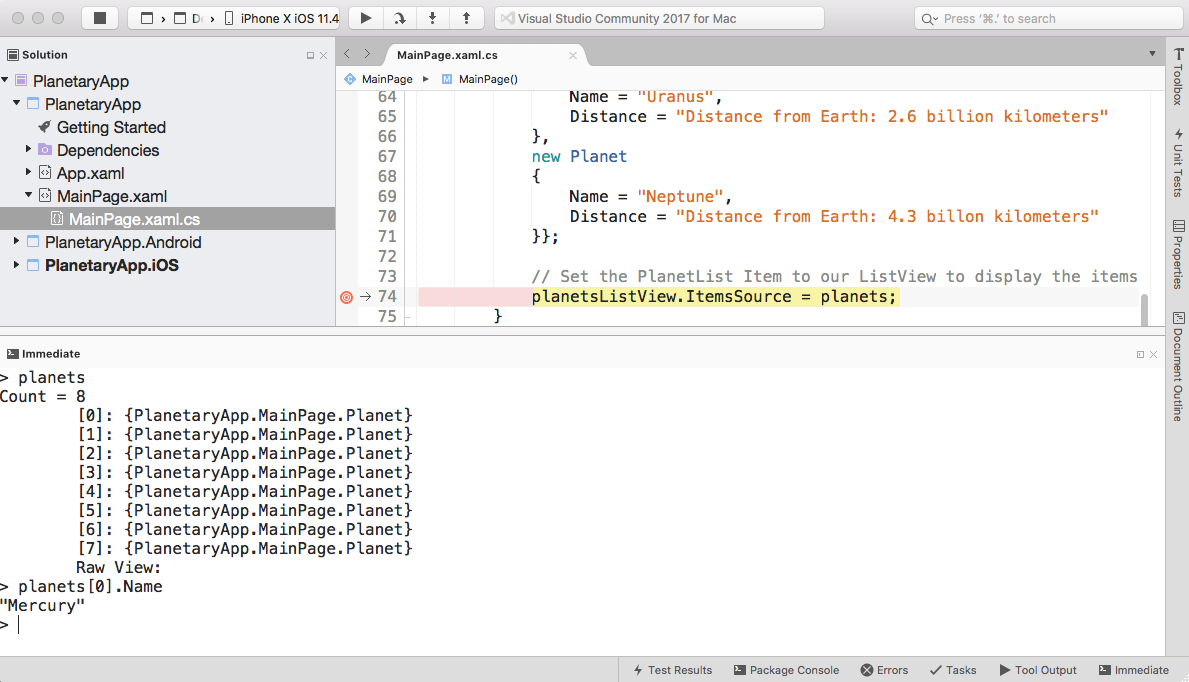
In this section, we will learn about the Visual Studio for Mac built-in debugger and how we can use this debugging tool to step through our code and debug our PlanetaryApp. You'll also learn how to work with and use the Immediate window to print out the contents of your code variables.
-
Book Overview & Buying
-
Table Of Contents

Mastering Xamarin UI Development - Second Edition
By :
Mastering Xamarin UI Development
By:
Overview of this book
This book will provide you with the knowledge and practical skills that are required to develop real-world Xamarin and Xamarin.Forms applications. You’ll learn how to create native Android app that will interact with the device camera and photo gallery, and then create a native iOS sliding tiles game. You will learn how to implement complex UI layouts and create customizable control elements based on the platform, using XAML and C# 7 code to interact with control elements within your XAML ContentPages.
You’ll learn how to add location-based features by to your apps by creating a LocationService class and using the Xam.Plugin.Geolocator cross-platform library, that will be used to obtain the current device location. Next, you’ll learn how to work with and implement animations and visual effects within your UI using the PlatformEffects API, using C# code.
At the end of this book, you’ll learn how to integrate Microsoft Azure App Services and use the Twitter APIs within your app. You will work with the Razor Templating Engine to build a book library HTML5 solution that will use a SQLite.net library to store, update, retrieve, and delete information within a local SQLite database. Finally, you will learn how to write unit tests using the NUnit and UITest frameworks.
Table of Contents (15 chapters)
Preface
 Free Chapter
Setting Up Visual Studio for Mac
Building a PhotoLibrary App Using Android
Building a SlidingTiles Game Using Xamarin.iOS
Creating the TrackMyWalks Native App
MVVM and Data Binding
Navigating Within the Mvvm Model
Adding Location-based Features Within Your App
Customizing the User Interface
Working with Animations in Xamarin.Forms
Working with the Razor Templating Engine
Incorporating Microsoft Azure App Services
Making Our App Social Using the Twitter API
Unit Testing Your Xamarin.Forms Apps
Other Books You May Enjoy