Book Image

Learning Predictive Analytics with R

By : Eric Mayor
Book Image

Learning Predictive Analytics with R

By: Eric Mayor

Overview of this book

This book is packed with easy-to-follow guidelines that explain the workings of the many key data mining tools of R, which are used to discover knowledge from your data. You will learn how to perform key predictive analytics tasks using R, such as train and test predictive models for classification and regression tasks, score new data sets and so on. All chapters will guide you in acquiring the skills in a practical way. Most chapters also include a theoretical introduction that will sharpen your understanding of the subject matter and invite you to go further. The book familiarizes you with the most common data mining tools of R, such as k-means, hierarchical regression, linear regression, association rules, principal component analysis, multilevel modeling, k-NN, Naïve Bayes, decision trees, and text mining. It also provides a description of visualization techniques using the basic visualization tools of R as well as lattice for visualizing patterns in data organized in groups. This book is invaluable for anyone fascinated by the data mining opportunities offered by GNU R and its packages.
Table of Contents (23 chapters)
Learning Predictive Analytics with R
Credits
About the Author
About the Reviewers
www.PacktPub.com
Preface
Exercises and Solutions
Index

Nested data


If you have nested data, this chapter is essential for you! What is meant by nested data is that observations share a common context. The examples include:

  • Consumers nested within shops

  • Employees nested within managers

  • Teachers and/or students nested within schools

  • Nurses, patients, and/or physicians nested within hospitals

  • Inhabitants nested in neighborhoods

We could imagine way more cases of data nesting. What they all have in common is a data structure similar to the one depicted in the following figure:

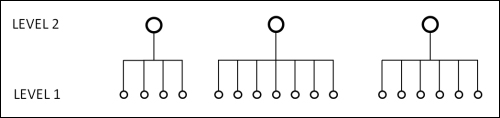
A depiction of nested data

We will only discuss two levels of data with unique membership in this chapter, but of course, more complex situations can arise. For instance, in all the preceding examples, shops, managers, schools, hospitals, and neighborhoods can be nested within higher level units (for example, companies, cities) which could be a third level in the analyses). Also, crossed memberships could be imagined, for example, patients sharing a hospital but not a neighborhood...