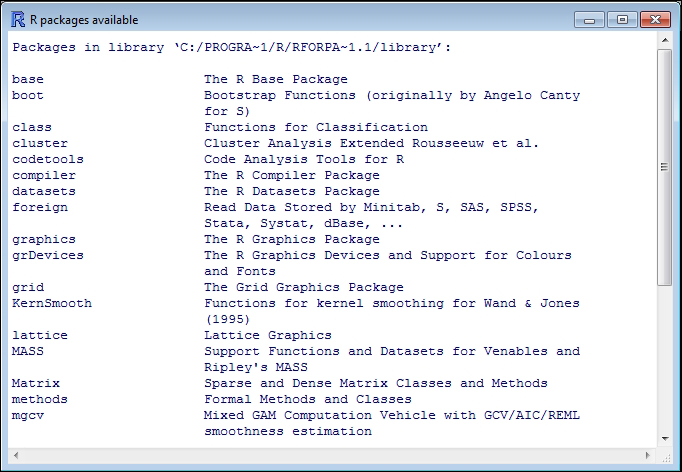
As mentioned earlier, GNU R is a statistical programming language that can be extended by means of packages. Packages contain functions and datasets that allow specific types of analyses to be performed in R. We have seen at the end of the last section that some packages are loaded by default in R. Others are already a part of R. The image below provides a list of the packages that come out of the box with R. This list can very easily be obtained with the following code:
library(lib = .Library)

Available packages in base R
Now, let's have a look at which packages are directly accessible, by selecting List search path from the Misc menu. This is what our output looks like:
[1].GlobalEnv package:stats package:graphics
[4] package:grDevices package:utils package:datasets
[7] package:methods Autoloads package:base
Accessible packages start with the prefix package:
Now, let's go a little further and list the content of one of these packages. In order to do this, type the following in the console:
objects(package:stats)
This will list the content of the stats package. The first two lines should look like this:
[1] acf acf2AR add.scope
[4] add1 addmargins aggregate
The content of this book is partly relying on packages that are not part of the basic installation of R. We will therefore need to install packages that we will download from CRAN. The Packages menu contains functions that allow installing and loading packages, as well as the configuration of local and distant repositories. Useful functions of the Packages menu include the following:
Load package: Provides a frontend for the
library()function, which loads a package provided as an argument.Install packages: Allows selecting a package to install. This requires configuring a mirror for CRAN first.
Install package(s) from local zip files: Opens a dialogue box in which a ZIP file containing a package can be selected for installation in R.
Tip
Mirrors are basically different copies of CRAN. In case one mirror is down, the others provide redundancy. You can use any, but the closest to you will generally be faster. We use 0-Cloud here.
We will discuss plotting in the next chapters. Most graphics in this book will be created using functions already available in R. These tools allow producing very accurate and informative graphics, but these are static. Sometimes, you might want to display your results on the web. Also, it sometimes comes in handy to be able to switch rapidly between two plots, for instance, to notice subtle differences. For these reasons, we will also introduce some basics of animation for displaying R plots on web pages. We will not discuss this in detail in this book, but we think it is something you might want a little introduction to.
In order to exercise the use of the menu and install the package required for animating graphics, let's start by installing the animation package. Select the Install package(s) function of the Packages menu, and then, select the animation package from the list. You will have to scroll down a little bit. If R asks you for a mirror, select 0-Cloud or a location next to you, and confirm by clicking OK.
Alternatively, the next line of code will install the required package:
install.packages("animation")Type this line of code in R Console; if you are using the e-book version of this book, copy and paste it in the console.
Alternatively, it is also possible to install packages in R from local files. This is useful in case the machine you are using R on does not have Internet access. To do so, use the Install package(s) from local zip function from the Packages menu and select the ZIP file containing the package you want to install. One easy way to do this is to copy the ZIP file in the working folder prior to attempting to install it. You can also use the following code, provided the package is called package_0.1 and is in the working folder:
install.packages(paste0(getwd(),"/package_0.1.zip")), repos = NULL)
What we have done here deserves a little explanation. We are calling three functions here. By calling install.packages(), we tell R that we want to install a package. The repos attribute is set to NULL, which tells R that we do not want to download the package from a repository but prefer to install the package from a local file instead. The first argument passed to the function is therefore a filename (not a package name on CRAN as in the previous example). As we do not want to type in the whole path to the ZIP file as the first argument (we could have done so), we instead use the paste0()function to concatenate the output of getwd(), which shows the current working folder, and the filename of the ZIP file containing the package (between parentheses). The previous line of code allowed us to introduce the use of string concatenation in R while installing a package.
As R will automatically look in the working folder, we could have typed the following:
install.packages("package_0.1.zip")), repos = NULL)Now that the animation package is installed, let's load it; select Load package from the Package menu. A dialogue box appears and prompts you to select the package that you want to load. If the installation was successful (which is most certainly the case if you didn't notice an error message), the package should be in the displayed list. Select it and confirm by clicking on OK.
Alternatively, you can simply type the following, which will also load the package:
library(animation)
A good thing to do when you load a package is to check that the functions you want to use are functional. For instance, it might be the case that some dependencies need to be installed first, although this should be done automatically when installing the package. In this book, we will use the saveHTML() function to animate some content and generate web pages from the plots. Let's test it with the following code:
1 df=data.frame(c(-3,3),c(3,-3))
2 saveHTML({
3    for (i in 1:20)  {
4       plot(df)
5       df = rbind(df,c(rnorm(1),rnorm(1)))
6    }
7 },
8 img.name = "plot",
9 imgdir = "unif_dir",
10 htmlfile = "test.html",
11 autobrowse = FALSE,
12 title = "Animation test",
13 description = "Testing the animation package for the first time.")
Line 1 creates a data frame of two columns. These are populated with -3 and 3 in the first row and with 3 and -3 in the second row. Lines 2 and 7 to 13 create and configure the animation. Lines 3 to 6 are where the content of the animation is generated. This is the part you might wish to modify to generate your own animations. Here, we plotted the values in the data frame and then added a new row containing random numbers. This code block will be iterated 20 times, as it is part of a for loop (see line 3). The reader is invited to consult an introduction to R if any of this is unclear.
For now, copy and paste the code in the console or type it in. The output should look like this:
animation option 'nmax' changed: 50 --> 20
animation option 'nmax' changed: 20 --> 50
HTML file created at: test.html
If you do not get the message above, first check whether the code that you typed in corresponds exactly to the code provided above. If the code corresponds, repeat steps 1 to 4 of the current section, as something might have gone wrong.
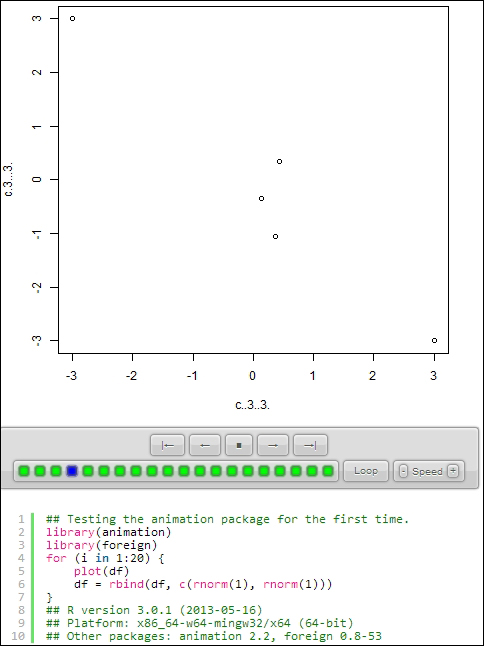
If you got the message above, open the HTML file in your browser. The file is in your working directory. The result should look like the image below. This is a scatter plot, which we will discuss further in the next chapter. The plot starts with the display of two data points, and then, new data points are randomly added. This plot (see below) is only provided as a test. Feel free to adapt the graphical content of the book by using the package (for example, you can simply paste the loops containing graphics in the code above, that is, instead of the for loop here), and of course, use your own data.

An animation produced using the Animation package
As an exercise in installing and loading packages, please install and load the prob package. When this is done, simply list the contents of the package.
We are sure that you have managed to do this pretty well. Here is how we would have done it. To install a package, we would have used the Install package(s) function in the Package menu. We could also have typed the following code:
install.packages("prob")Alternatively, we would have downloaded the .zip file (currently, prob_0.9-2.zip) from CRAN: http://cran.r-project.org/web/packages/prob/.
Then, we would have used Install package(s) from local zip from the
Packages menu and selected the ZIP file containing the prob package in the dialogue box.
Finally, we would have used the following code instead:
path = "c:\\user\\username\\downloads\\prob_0.9-2.zip" install.packages(path, repos = NULL)
In order to load the package, we would have selected Load package from the Package menu, and chosen the file containing the package in the dialogue box.
This might be counterintuitive, but using code is way easier and more efficient than using the GUI. In order to load the prob package, we could have also simply used the following code:
library(prob)
We would have listed the contents of the package by using the objects() function:
objects(package:prob)
The output lists 43 functions.
We have presented the exercises in the chapter together with their solutions here. The exercises for the next chapters will be part of the Appendix A, Exercises and Solutions, together with their solutions.


