

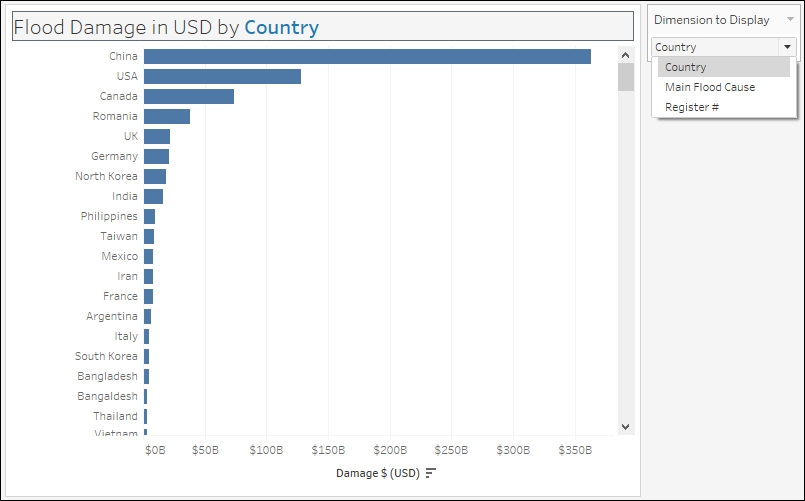
In this recipe, we will explore how to display different dimensions in the same graph using a parameter and calculated field.
To follow this recipe, open B05527_03 – STARTER.twbx. Use the worksheet called Dynamic Dimension, and connect to the MasterTable (FlooddataMasterListrev) data source.
The following are the steps to create a chart with dynamic dimensions:
Right-click the arrow beside the Dimensions section in the sidebar, and select Create Parameter.
Create a string parameter called
Dimension to Displaywith the following settings:
Show the parameter control for Dimension to Display. You can do this by right-clicking on the parameter, and selecting Show Parameter Control.
Create a calculated field called
Selected Dimension, with the following formula:
From Dimensions, drag the calculated field Selected Dimension to the Rows shelf.

From Measures, drag Damage $ (USD) to the Columns shelf.