
In this recipe, we will walk through the strategy to display and sort measures based on user selection.

To follow this recipe, open B05527_03 – STARTER.twbx. Use the worksheet called Dynamic Measure Display and Sort, and connect to the MasterTable (FlooddataMastListrev) data source.

The following are the steps to create a chart that enables displaying and sorting measures through a parameter:
Right-click the arrow beside the Dimensions section in the side bar, and select Create Parameter.
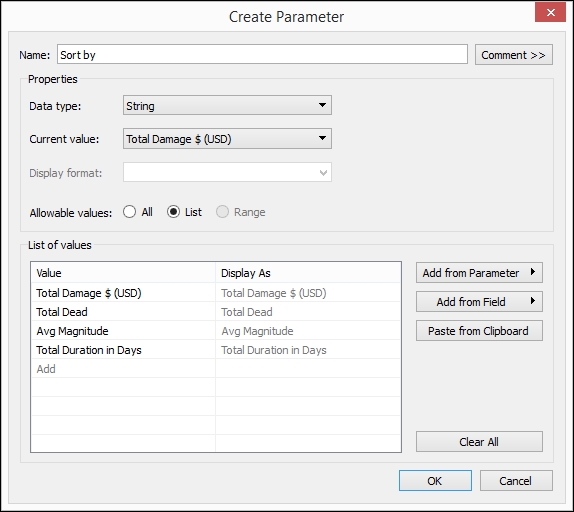
Create a string parameter called Sort by with the following settings:
Show the parameter control for Sort by. You can do this by right-clicking on the parameter, and selecting Show Parameter Control.
Create another parameter called
Sort directionwith the following settings:
Show the Sort direction parameter control.
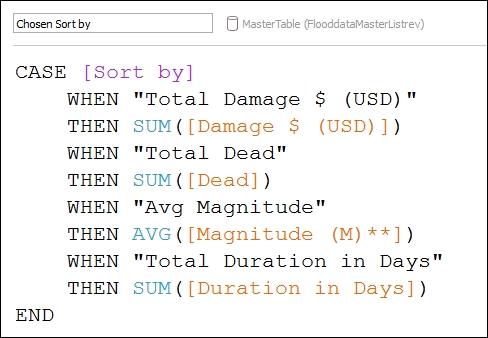
Create a calculated field called
Chosen Sort bywith the following formula: