

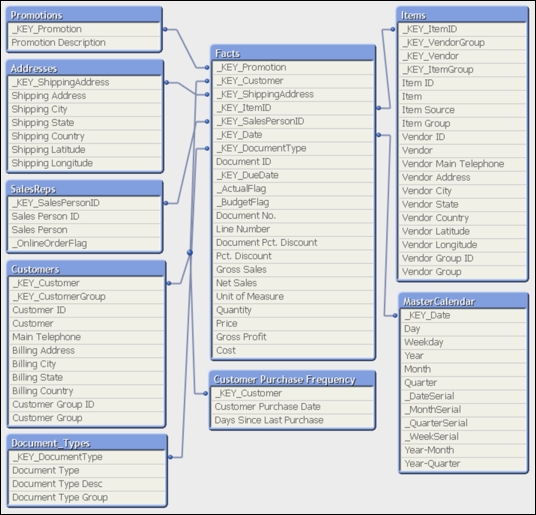
Our company sells gadgets to customers throughout the United States and our sales perspective data model is based on data from an ERP system. The following figure shows the data model that we are going to work with throughout this chapter:
With the following steps, let's migrate the sales perspective container from the book's exercise files to where we've installed QDF on our computers and start to explore the data together:
In the
Ch. 2folder of the book's exercise files, copy the container called1001.Sales_Perspectiveto theQDFfolder that is located on your computer. By default, theQDFfolder will beC:\Qlik\SourceDate.In the
QDFfolder, open theVariableEditor Shortcutin the0.Administrationcontainer.Click
Container Map Editor. If the button hangs, then enable the Open Databases in Read and Write mode in the Setting tab of the Edit Script window and try again.In the container map table, go to the empty line after
99.Shared_Folders, and under...