

Artifacts of the user interface explained
Now that we have explored the basic possibilities of PAD, let’s take a detailed look at the application and its possibilities. PAD consists of two windows:
- The container window or Power Automate console
- The Desktop flow designer window
The Power Automate container window
The first window we will see when we start the program is the container window, also known as the Power Automate console. The following screenshot shows this window:
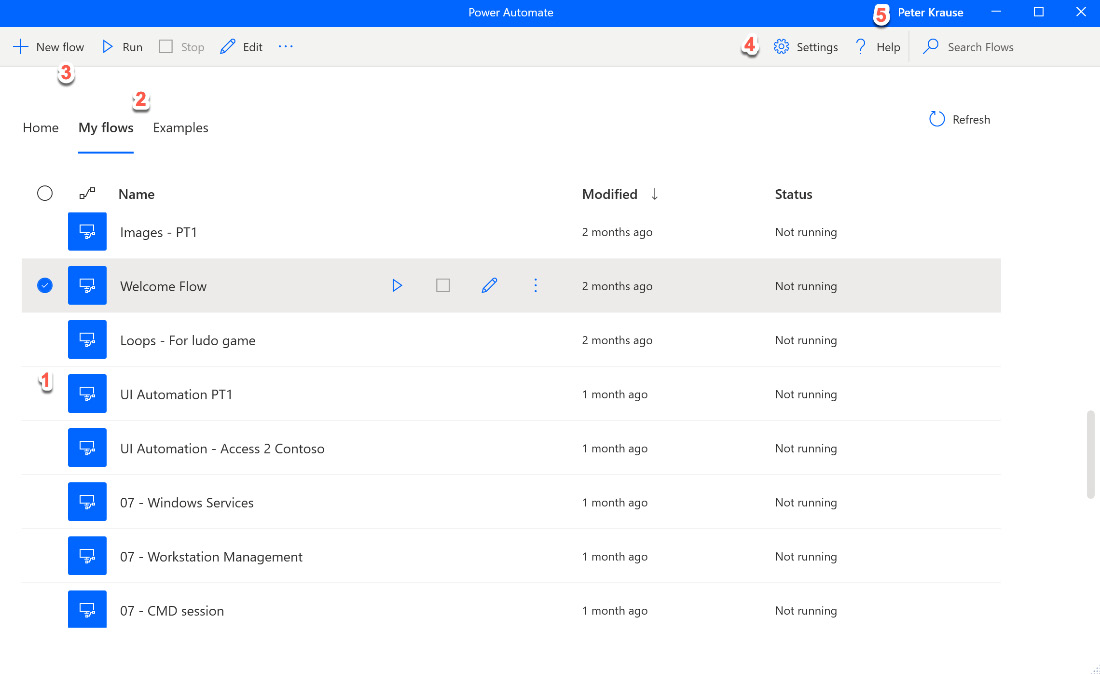
Figure 2.19 – PAD container window
It contains the following elements:
- List of UI flows: If you hover over an item in the list, you will be presented with different additional options, such as the play button or the edit button. While the edit button just opens the designer window (see the following figure), the start button runs the flow immediately without opening the designer window first.
You will also get some desktop notifications on the flow’s status (has been started, was successful, and so on):
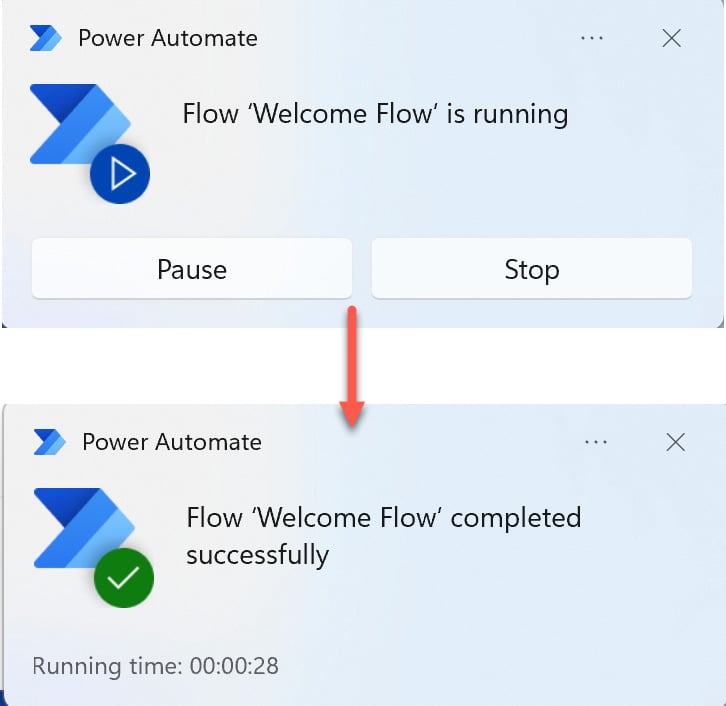
Figure 2.20 – Windows notification on the flow
The three dots to the right of the edit button will reveal a context menu where you can also run or edit the flow but also rename, delete, or copy the flow:
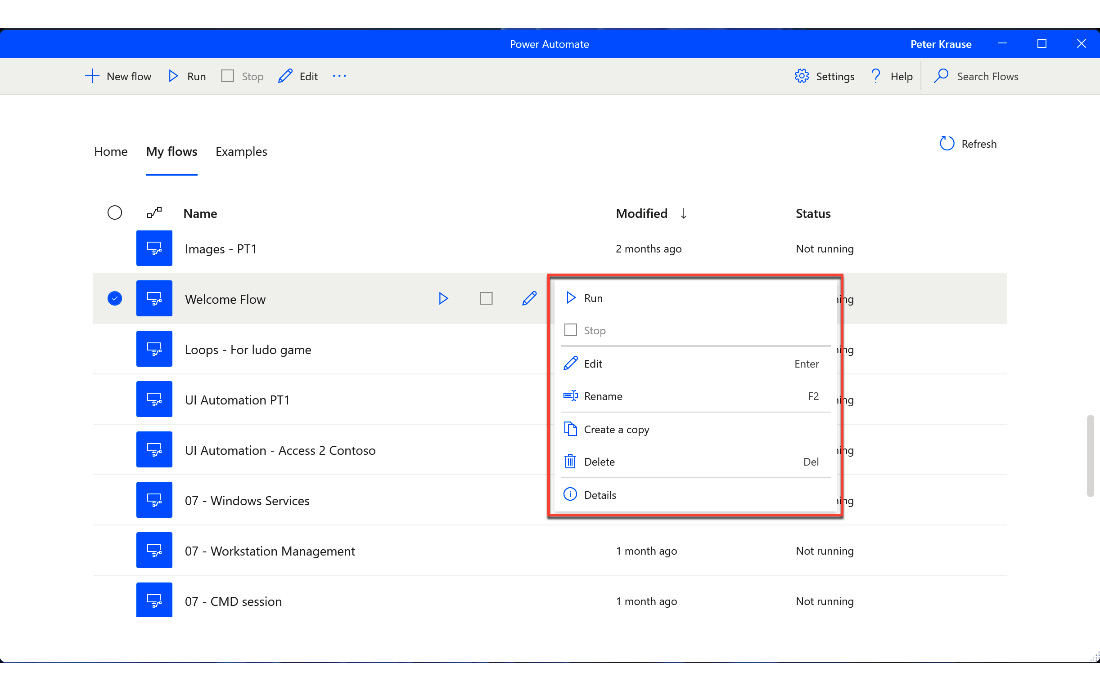
Figure 2.21 – Flow list context menu
The Details option gives shows the properties of the flow, including its name and description, owner, the date for creation, and the last modification.
- The console area switch: You can also switch from the My flows tab to the Examples tab. Here, different examples provided by Microsoft are presented, including automation for Excel, desktop, the web, and more. Although the examples do not cover the scope of the program, it may be worthwhile to have a look there to possibly try out one of them.
- Create a new flow: This button launches a dialog where you can enter the name for a new UI flow. Although this is optional, it is reasonable to provide a meaningful name for the flow. There is a Create button to confirm the name and launch the designer window with a blank canvas.
- PAD settings: This button launches the Settings dialog. Here, we can modify the launch behavior of PAD and also use a hotkey to stop a running flow. In addition, the monitoring and notification settings can be changed (Windows notification, flow monitoring window, or no notification).
- Login information: Clicking on the name in the title bar provides information about the current user and their login information. Here, it is also possible to sign out and log on with another user.
The designer window
Let’s take a closer look at the designer window now:
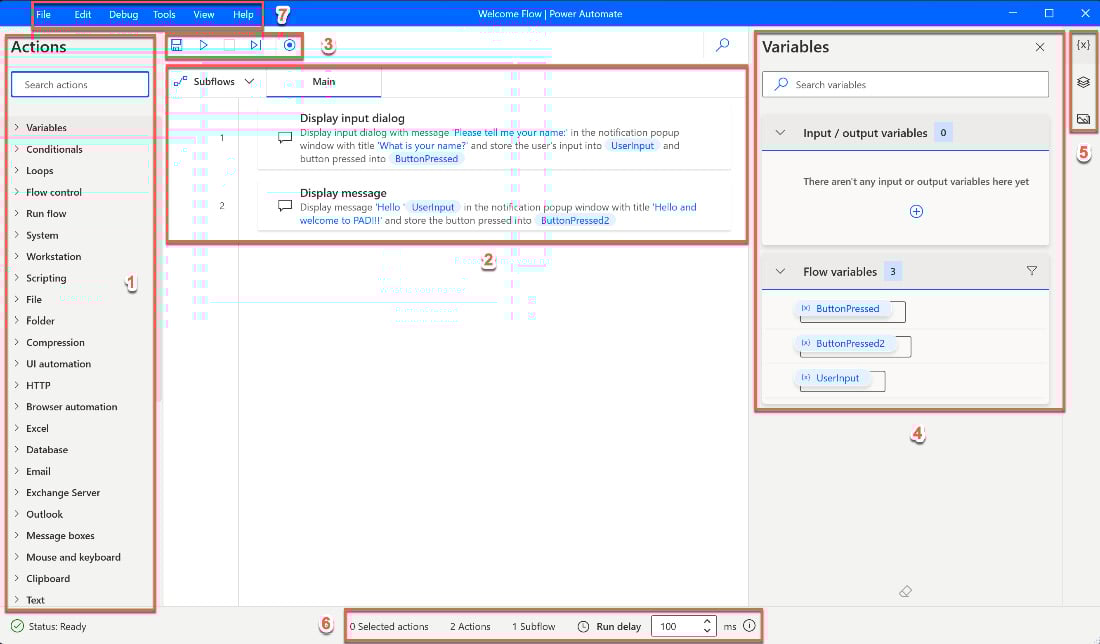
Figure 2.22 – The designer window of PAD
Here, we have the following elements:
- The Actions pane: The left-hand side of the window belongs to the Actions pane. Actions represent functionality that a flow is capable of, such as “Open Excel” or “Get files in a folder.” These actions are grouped into different categories such as System or Folder You can see all the actions that belong to a category by expanding the corresponding item. Just click on the arrow icon on the left of the category. Throughout this book, we will look at each of these actions. At the top of the list, there is also a Search box. If you enter a search term here, the list of actions gets filtered by this search term. We used this in our first flow.
- The flow designer area: In the middle of the window, there is a canvas that contains all the actions this flow is made of. Actions can be placed there by dragging them from the Actions pane. When a flow is started, the actions will run in the sequence in which they are listed here. This action list can be rearranged by just clicking and dragging an existing entry and putting it somewhere else. There will be a horizontal line displayed showing where an action can be placed. We saw this in our previous example. You can also double-click on an action to bring up the settings dialog for that action and modify the entries. In this area, there is also an option to look at the subflows. A subflow is just another UI flow that encapsulates a specific set of actions. By using subflows, it is possible to structure a large flow into different pieces. A subflow always belongs to a regular flow and is not shared between other flows.
- The flow control bar: The little bar at the top of the action list allows you to save, start, stop, and record a flow. There is also an option to start the flow and go action by action, which is also called debugging. We will take a closer look at this, as well as the recorder, in the next section.
- The Variables viewer pane: On the right-hand side, there’s an area that displays the variables of the flow. Variables are an important aspect of a flow for storing information during runtime. Variables will be covered in Chapter 5.
- The input elements switch: Please also notice the two additional little icons below the variables icon, {x}. These can be used to switch to the area containing UI elements and images, which will also be covered later. You can hide this area by clicking on the icon.
- Action and execution summary: At the bottom, there is a little bar that summarizes the current flow. It is also possible to set a specific delay for the flow to run – in this example, 100 milliseconds.
This is the applications menu bar. In addition to the typical functionality for saving and editing, the debug functionality is also available here once again, in which breakpoints can also be set. This allows a flow to be executed up to a certain point so that we can check the settings and variables in the event of an error:
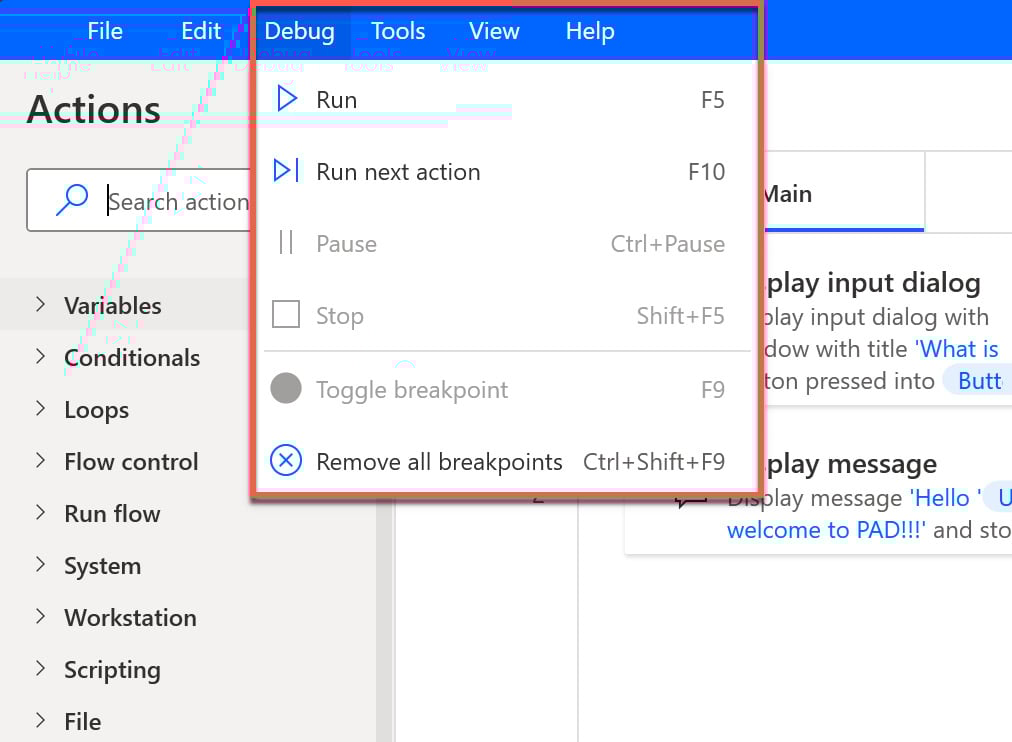
Figure 2.23 – The Debug menu
This designer window will also show up in another area at the bottom of the screen when a flow runs into an error. There will be detailed information about where the flow stopped and why. Now that we have a few more details, we’ll use the recorder to create another flow in the next section.