

Building smart diagrams
At first, let’s focus on a quick win – getting a diagram with minimal technical effort. So we would just need to fill in our thoughts.
The smartdiagram package makes building diagrams of various types very easy.
How to do it...
Once you have loaded the smartdiagram package, you only need a simple command. Follow these steps:
- As always, begin with any document class:
\documentclass{article} - Load the smartdiagram package:
\usepackage{smartdiagram} - Start the document:
\begin{document} - Define the diagram. An option in square brackets defines the type, and an argument in curly braces contains a comma-separated list of items:
\smartdiagram[flow diagram:horizontal]{Edit, \LaTeX, Bib\TeX/ biber, make\-index, \LaTeX} - End the document:
\end{document} - Compile, and take a look at the output:
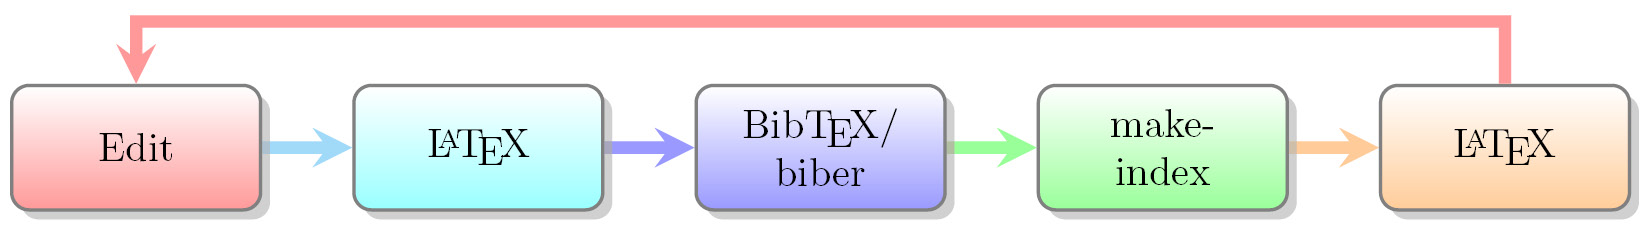
Figure 6.1 – A horizontal flow chart