Sign In Start Free Trial
Account

Add to playlist

Create a Playlist

Modal Close icon
You need to login to use this feature.
  • Book Overview & Buying Mastering Kibana 6.x
  • Table Of Contents Toc
Mastering Kibana 6.x

Mastering Kibana 6.x

5 (1)
close
close
Mastering Kibana 6.x

Mastering Kibana 6.x

5 (1)

Overview of this book

Kibana is one of the popular tools among data enthusiasts for slicing and dicing large datasets and uncovering Business Intelligence (BI) with the help of its rich and powerful visualizations. To begin with, Mastering Kibana 6.x quickly introduces you to the features of Kibana 6.x, before teaching you how to create smart dashboards in no time. You will explore metric analytics and graph exploration, followed by understanding how to quickly customize Kibana dashboards. In addition to this, you will learn advanced analytics such as maps, hits, and list analytics. All this will help you enhance your skills in running and comparing multiple queries and filters, influencing your data visualization skills at scale. With Kibana’s Timelion feature, you can analyze time series data with histograms and stats analytics. By the end of this book, you will have created a speedy machine learning job using X-Pack capabilities.
Table of Contents (16 chapters)
close
close

Timelion interface


On Kibana, we have a link Timelion on the left menu and by clicking on it we can open the Timelion interface:

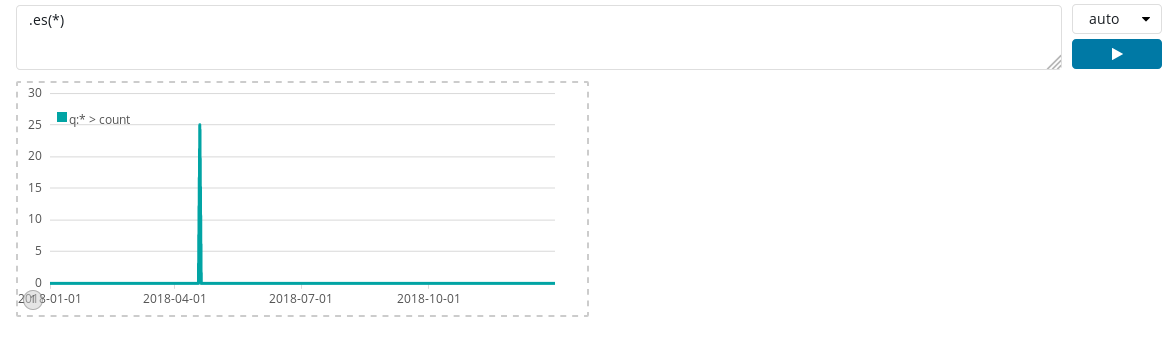
On the Timelion screen, we can see a textbox with the .es(*) expression, which denotes that currently we are getting data from all the indices. The .es function counts the number of documents in Elasticsearch and creates the default graph showing the amount of documents created over a selected time span. It shows the default query, which fetches everything from Elasticsearch and draws it over time. In front of the expression box, we have a dropdown to set the refresh duration and below that dropdown we have an execute button, which is used to run the query written inside the expression box.

We have a visualization below the expression box, which shows the timeseries graph. Timelion provides with us hints such as, if we put a dot after .es(*), then Kibana will show us the list of functions available in a dropdown:


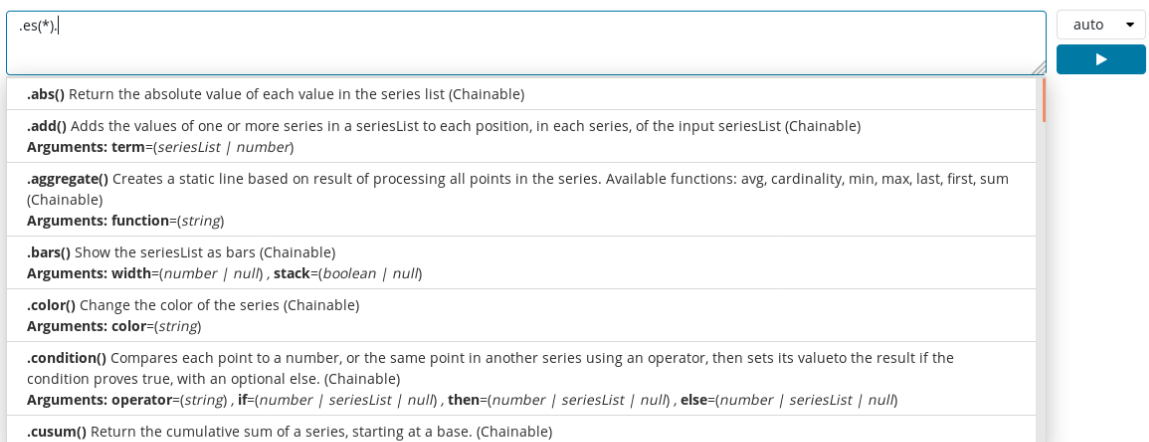
We can see the functions in the dropdown in ascending...

CONTINUE READING
83
Tech Concepts
36
Programming languages
73
Tech Tools
Icon Unlimited access to the largest independent learning library in tech of over 8,000 expert-authored tech books and videos.
Icon Innovative learning tools, including AI book assistants, code context explainers, and text-to-speech.
Icon 50+ new titles added per month and exclusive early access to books as they are being written.
Mastering Kibana 6.x
notes
bookmark Notes and Bookmarks search Search in title playlist Add to playlist font-size Font size

Change the font size

margin-width Margin width

Change margin width

day-mode Day/Sepia/Night Modes

Change background colour

Close icon Search
Country selected

Close icon Your notes and bookmarks

Confirmation

Modal Close icon
claim successful

Buy this book with your credits?

Modal Close icon
Are you sure you want to buy this book with one of your credits?
Close
YES, BUY

Submit Your Feedback

Modal Close icon
Modal Close icon
Modal Close icon