

Power BI licensing considerations
At this point, you may be wondering how Power BI licensing affects data modeling. It does, as each licensing tier comes with a set of features that can potentially affect the data modeling. Nevertheless, regardless of the licensing tier you are using, Power BI Desktop is free of charge. In this section, we'll quickly look at some licensing considerations related to data modeling.
The following table is a simplified version of the Power BI feature comparisons published on the Microsoft website separately based on different licenses:
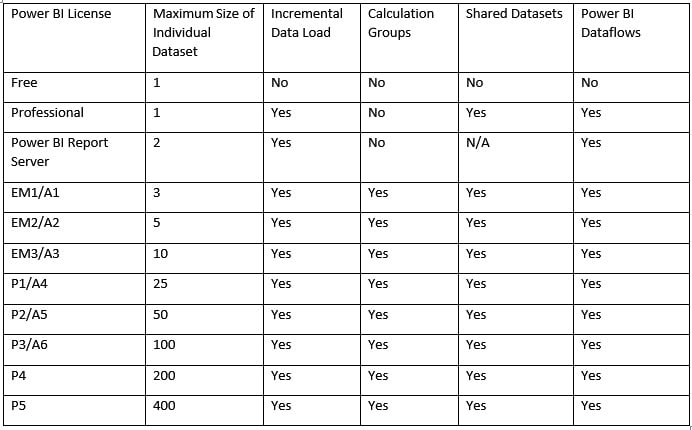
Figure 1.19 – A simplified version of Power BI feature comparisons
Maximum size of individual dataset
As the table illustrates, we are limited to 1 GB for each dataset published to the Power BI service under Free or Professional licensing. Therefore, managing the file size is quite important. There are several ways to keep the file size just below the limit, as follows:
- Import the necessary columns only.
- Import just a portion of data when possible. Explain the technology limitation to the business and ask whether you can filter out some data. For instance, the business may not need to analyze 10 years of data, so filter older data in Power Query.
- Use aggregations. In many cases, you may have the data stored in the source at a very low granularity. However, the business requires data analysis on a higher grain. Therefore, you can aggregate the data to a higher granularity, then import it into the data model. For instance, you may have data stored at a minute level. At the same time, the business only needs to analyze that data at the day level.
- Consider disabling auto date/time settings in Power BI Desktop.
- Consider optimizing data types.
We will cover all the preceding points in the upcoming chapters.
Incremental data load
One of the coolest features available in Power BI is the ability to set up an incremental data load. Incremental data loading in Power BI is inherited from SSAS to work with large models. When it is set up correctly, Power BI does not truncate the dataset and re-import all the data from scratch. Instead, it only imports the data that has been changed since the last data refresh. Therefore, incremental data load can significantly improve the data refresh performance and decrease the amount of processing load on your tenant. Incremental data load is available in both Professional and Premium licenses.
Calculation groups
Calculation groups are like calculated members in MultiDimensional eXpressions (MDX). Calculation groups were initially introduced in SSAS 2019 Tabular models. They are also available in Azure Analysis Services and all Power BI licensing tiers.
It is a common scenario that you create (or already have) some base measures in your Power BI model and then create many time intelligence measures on top of those base measures. In our sample file, we have three measures, as follows:
- Product cost:
SUM('Internet Sales'[TotalProductCost]) - Order quantity:
SUM('Internet Sales'[OrderQuantity]) - Internet sales:
SUM('Internet Sales'[SalesAmount])
The business requires the following time intelligence calculations on top of all the preceding measures:
- Year to date
- Quarter to date
- Month to date
- Last year to date
- Last quarter to date
- Last month to date
- Year over year
- Quarter over quarter
- Month over month
We have nine calculations to be built on top of every single measure we have in our model. Hence, we end up having 9 x 3 = 27 measures to build in our model. You can imagine how quickly the number of measures can rise in the model, so you should not be surprised if someone tells you that they have hundreds of measures in their Power BI model.
Another common scenario is when we have multiple currencies. Without calculation groups, you need to convert the values into strings to show the figures and use a relevant currency symbol using the FORMAT() function in DAX. Now, if you think about the latter point, combined with time intelligence functions, you can see how the issue can get bigger and bigger.
Calculation groups solve those sorts of problems. We cover calculation groups in Chapter 10, Advanced Data Modeling Techniques.
Shared datasets
As the name implies, a shared dataset is a dataset used across various reports in a modern workspace (a new workspace experience) within the Power BI service. Therefore, it is only available in the Power BI Professional and Power BI Premium licensing plans. This feature is quite crucial to data modelers. It provides more flexibility in creating a more generic dataset, covering more business entities in a single dataset instead of having several datasets that may share many commonalities.
Power BI Dataflows
Dataflows, also referred to as Power Query Online, provide a centralized data preparation mechanism in the Power BI service that other people across the organization can take advantage of. Like using Power Query in Power BI Desktop for data preparation, we can prepare, clean, and transform the data in dataflows. Unlike Power Query queries, which are isolated within a dataset, when created in Power BI Desktop and then published to the Power BI service, you can share all data preparations, data cleansing, and data transformation processes across the organization with dataflows.
You can create Power BI dataflows inside a workspace, so it is only available to Professional and Premium users. We will also cover Power BI dataflows in future chapters.