Book Image

The Economics of Data, Analytics, and Digital Transformation

By : Bill Schmarzo
5 (2)
Book Image

The Economics of Data, Analytics, and Digital Transformation

5 (2)
By: Bill Schmarzo

Overview of this book

In today’s digital era, every organization has data, but just possessing enormous amounts of data is not a sufficient market discriminator. The Economics of Data, Analytics, and Digital Transformation aims to provide actionable insights into the real market discriminators, including an organization’s data-fueled analytics products that inspire innovation, deliver insights, help make practical decisions, generate value, and produce mission success for the enterprise. The book begins by first building your mindset to be value-driven and introducing the Big Data Business Model Maturity Index, its maturity index phases, and how to navigate the index. You will explore value engineering, where you will learn how to identify key business initiatives, stakeholders, advanced analytics, data sources, and instrumentation strategies that are essential to data science success. The book will help you accelerate and optimize your company’s operations through AI and machine learning. By the end of the book, you will have the tools and techniques to drive your organization’s digital transformation. Here are a few words from Dr. Kirk Borne, Data Scientist and Executive Advisor at Booz Allen Hamilton, about the book: "Data analytics should first and foremost be about action and value. Consequently, the great value of this book is that it seeks to be actionable. It offers a dynamic progression of purpose-driven ignition points that you can act upon."
Table of Contents (14 chapters)
10
Other Books You May Enjoy
11
Index
Appendix A: My Most Popular Economics of Data, Analytics, and Digital Transformation Infographics

Step 5: Identify Potential Data Sources and Instrumentation Strategy

The next step is to brainstorm with the business stakeholders what data you might need to make the predictions identified in Step 4. To facilitate the data sources brainstorming, we simply add the phrase "and what data might you need to make that prediction?" to the prediction statement.

For example:

  • What will revenues and profits likely be next year…and what data might you need to make that prediction? The data source suggestions might include commodity price history, economic conditions, trade tariffs, fertilizer and pesticide prices, weather conditions, fuel prices, and more.
  • How much fertilizer will I likely need next planting season…and what data might you need to make that prediction? The data source suggestions might include pesticide and herbicide usage history, weather conditions, crops to be planted, pest forecasts, soil conditions, and more.

We complete the brainstorming session between the business stakeholders and the data science team by creating a matrix of ranked data sources, using the aggregated judgement and experience of the business stakeholders, that estimates their potential predictive relevance for each Use Case (see Figure 2.6).

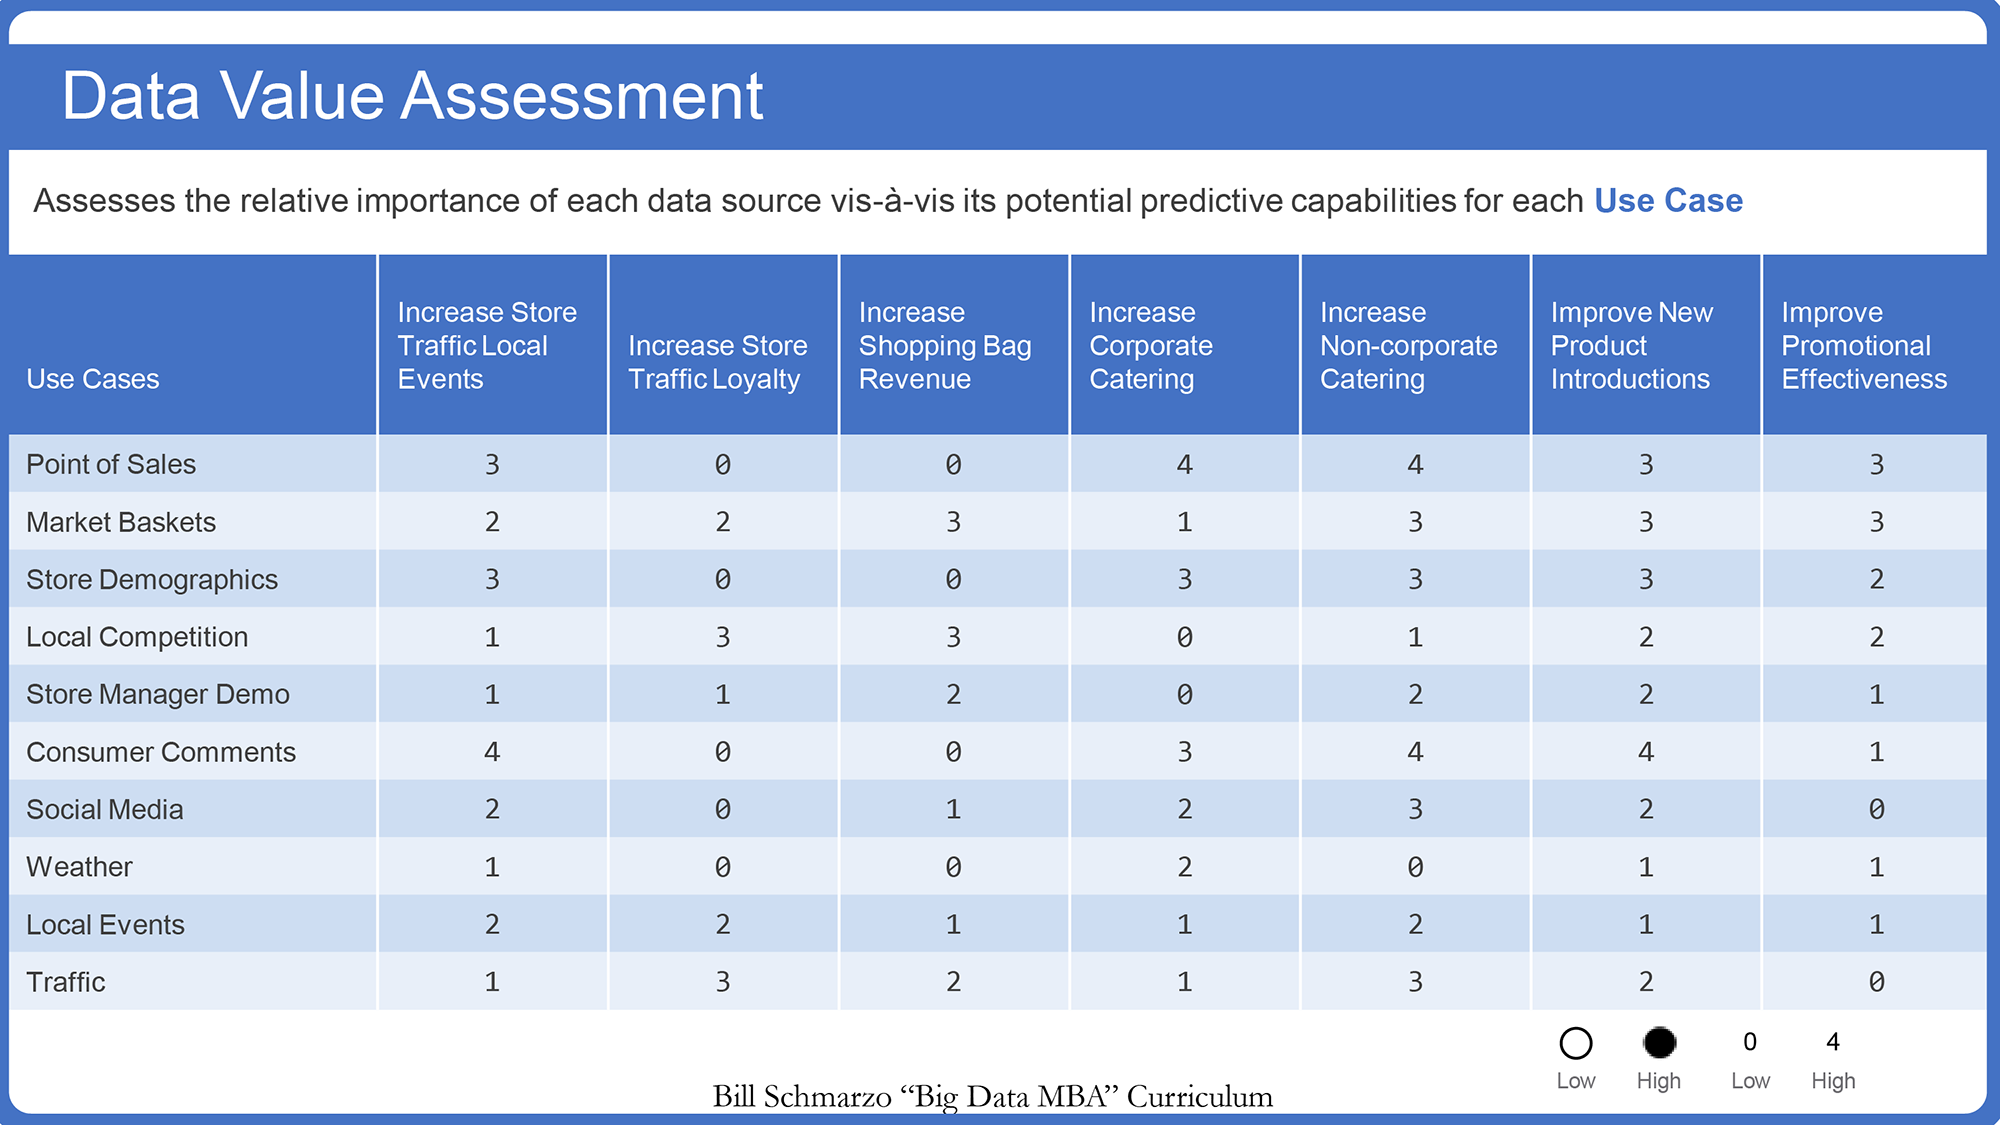
Figure 2.6: Data Value Assessment Matrix example

The data science team can then use the relative data source rankings in Figure 2.6 to start their analytic exploration process.

DEAN OF BIG DATA TIP:

Note: do not try to pass judgement on the viability of the data sources during the stakeholder brainstorming session. The data science team will have time later to determine the viability of the identified data sources.