Book Image

Enhanced Test Automation with WebdriverIO

By : Paul M. Grossman, Larry C. Goddard
Book Image

Enhanced Test Automation with WebdriverIO

By: Paul M. Grossman, Larry C. Goddard

Overview of this book

This book helps you embark on a comprehensive journey to master the art of WebdriverIO automation, from installation through to advanced framework development. You’ll start by following step-by-step instructions on installing WebdriverIO, configuring Node packages, and creating a simple test. Here you’ll gain an understanding of the mechanics while also learning to add reporting and screen captures to your test results to enhance your test case documentation. In the next set of chapters, you’ll delve into the intricacies of configuring and developing robust method wrappers, a crucial skill for supporting multiple test suites. The book goes beyond the basics, exploring testing techniques tailored for Jenkins as well as LambdaTest cloud environments. As you progress, you’ll gain a deep understanding of both TypeScript and JavaScript languages and acquire versatile coding skills. By the end of this book, you’ll have developed the expertise to construct a sophisticated test automation framework capable of executing an entire suite of tests using WebdriverIO in either TypeScript or JavaScript, as well as excel in your test automation endeavors and deliver reliable, efficient testing solutions.
Table of Contents (20 chapters)
16
Epilogue
Appendix: The Ultimate Guide to TypeScript Error Messages, Causes, and Solutions

Configuring debugging with VS Code

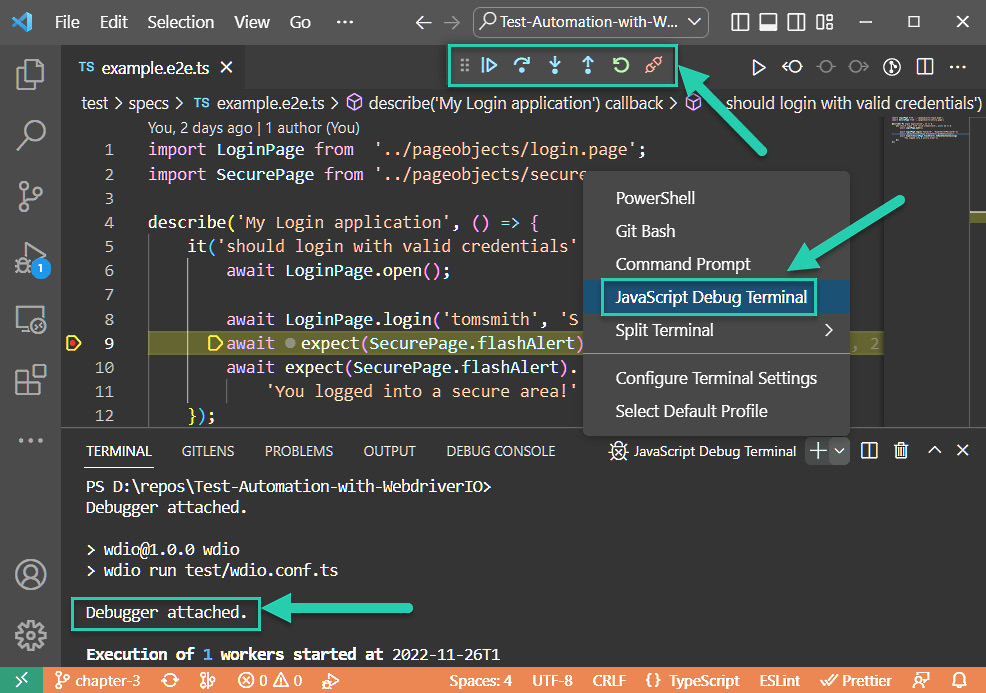
VS Code supplies four command prompt shells to launch scripts. Which one you use depends on your operating system. For Windows, there is PowerShell, Git Bash, Command Prompt, and the JavaScript debug terminal. Mac includes the ZSH shell:

Figure 3.4 – VS Code debugging controls and shell terminals on Windows

Figure 3.4 – VS Code debugging controls and shell terminals on Windows

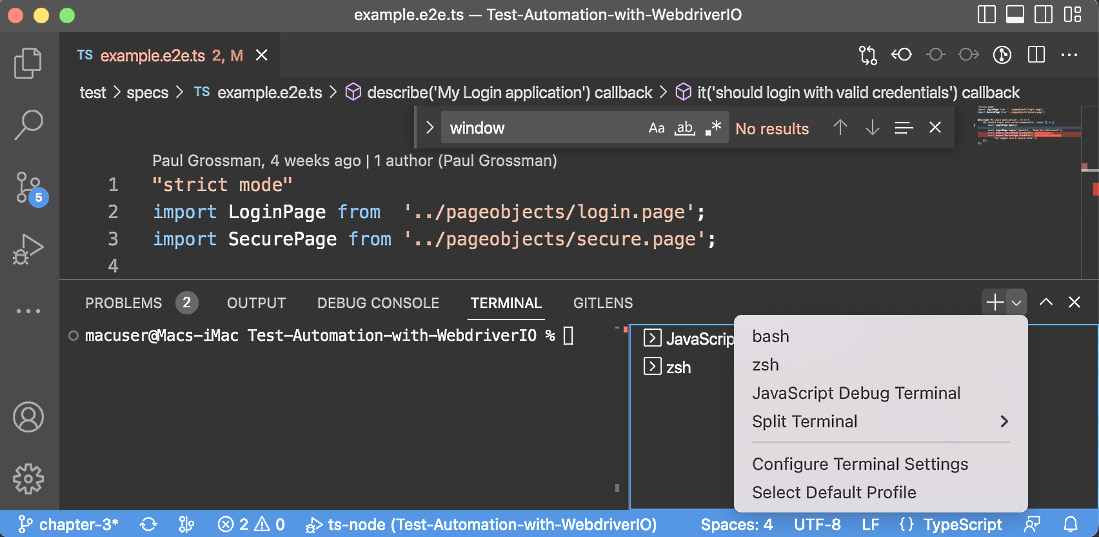
Here’s how it looks on Mac:

Figure 3.5 – VS Code debugging controls and shell Terminals on Mac

Figure 3.5 – VS Code debugging controls and shell Terminals on Mac

Script execution stops when a breakpoint is entered in the code by clicking in the gutter to the left of a line number, as seen on line 9. This will attach a debugger and a control panel. From the panel, the code execution can continue, step over a method call, step into the method, step out back up to the calling code, or restart or disconnect the debugging session.

The JavaScript debug terminal always attaches the debugger. Debug mode slows the execution. So, for Mac...