

These nodes in the previous example are a little too close together and we have a hard time seeing the edges. To add more distance between the nodes, we can specify a link distance. This is demonstrated by the following example:
Note
bl.ock (11.2): http://goo.gl/dd1T3O
The one modification this example makes to the previous one is that it increases the link distance to 200 (the default is 20):
var force = d3.layout.force()
    .nodes(data.nodes)
    .links(data.edges)
    .size([width, height])
    .linkDistance(200)
    .start();
This modification results in some better spacing of the nodes at the end of the simulation:
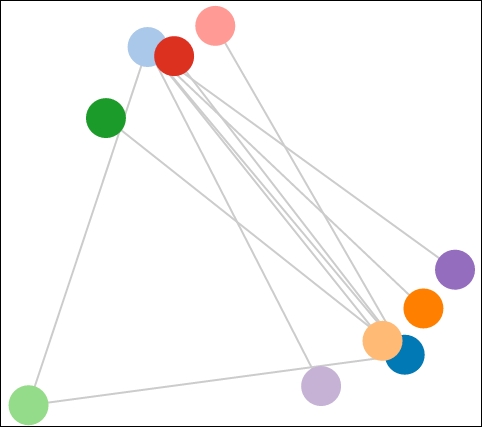
Drag the nodes around. It will demonstrate some of the physics in play:
No matter where you move any node(s), the graph returns to the center of the visualization. This is the effect of gravity on the layout and of it being placed in the center.
The nodes always come together, but are always at least the link distance apart. The gravity...