Book Image

D3.js By Example

By : Michael Heydt
Book Image

D3.js By Example

By: Michael Heydt

Overview of this book

<p>This book will take you through all the concepts of D3.js starting with the most basic ones and progressively building on them in each chapter to expand your knowledge of D3.js.</p> <p>Starting with obtaining D3.js and creating simple data bindings to non-graphical HTML elements, you will then master the creation of graphical elements from data. You’ll discover how to combine those elements into simple visualizations such as bar, line, and scatter charts, as well as more elaborate visualizations such as network diagrams, Sankey diagrams, maps, and choreopleths.</p> <p>Using practical examples provided, you will quickly get to grips with the features of D3.js and use this learning to create your own spectacular data visualizations with D3.js.</p>
Table of Contents (20 chapters)
D3.js By Example
Credits
About the Author
About the Reviewers
www.PacktPub.com
Preface
5
Using Data and Scales
Index

Transparency


SVG supports drawing of transparent elements. This can be done by either setting the opacity attribute or by using the rgba (red-green-blue-alpha) value when specifying a color.

The following example renders three circles of different colors, all of which are 50 percent transparent. The first two use the opacity attribute, and the third uses a transparent color specification for the fill.

<circle cx="150" cy="150" r="100" 
        style="fill:red" opacity="0.5" />
<circle cx="250" cy="150" r="100" 
        style="fill:green" opacity="0.5" />
<circle cx="200" cy="250" r="100" 
        style="fill:rgba(0, 0, 255, 0.5)" />
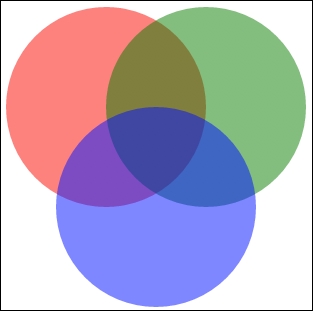
Note

bl.ock (3.20): http://goo.gl/xRzArg