Book Image

D3.js By Example

By : Michael Heydt
Book Image

D3.js By Example

By: Michael Heydt

Overview of this book

<p>This book will take you through all the concepts of D3.js starting with the most basic ones and progressively building on them in each chapter to expand your knowledge of D3.js.</p> <p>Starting with obtaining D3.js and creating simple data bindings to non-graphical HTML elements, you will then master the creation of graphical elements from data. You’ll discover how to combine those elements into simple visualizations such as bar, line, and scatter charts, as well as more elaborate visualizations such as network diagrams, Sankey diagrams, maps, and choreopleths.</p> <p>Using practical examples provided, you will quickly get to grips with the features of D3.js and use this learning to create your own spectacular data visualizations with D3.js.</p>
Table of Contents (20 chapters)
D3.js By Example
Credits
About the Author
About the Reviewers
www.PacktPub.com
Preface
5
Using Data and Scales
Index

Strokes, caps, and dashes


SVG shapes have an attribute known as stroke. The attribute stroke specifies the color of a line that outlines an SVG shape. We saw the use of stroke with a line, but it can be used with most of the SVG elements.

Whenever we specify stroke, we usually also specify a stroke width using the stroke-width attribute. This informs SVG about the thickness (in pixels) of the outline that will be rendered.

To demonstrate 
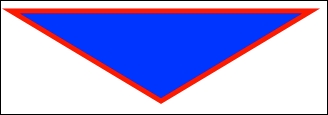
stroke and stroke-width attributes, the following example recreates the path from the path example, and sets a stroke to be 10 pixels thick, using red as its color. Additionally, we set the fill of the path to blue. We set all the attributes using the style property of stroke:

<path d="M 10 10 L 210 10 L 110 120 z"
      style="fill:blue;stroke:red;stroke-width:5" />

The preceding example results in the following rendering:

Note

bl.ock (3.10): http://goo.gl/dMjdUX

As we saw earlier, we can set stroke on a line. It can also have its stroke-width set. Let...