Book Image

D3.js By Example

By : Michael Heydt
Book Image

D3.js By Example

By: Michael Heydt

Overview of this book

<p>This book will take you through all the concepts of D3.js starting with the most basic ones and progressively building on them in each chapter to expand your knowledge of D3.js.</p> <p>Starting with obtaining D3.js and creating simple data bindings to non-graphical HTML elements, you will then master the creation of graphical elements from data. You’ll discover how to combine those elements into simple visualizations such as bar, line, and scatter charts, as well as more elaborate visualizations such as network diagrams, Sankey diagrams, maps, and choreopleths.</p> <p>Using practical examples provided, you will quickly get to grips with the features of D3.js and use this learning to create your own spectacular data visualizations with D3.js.</p>
Table of Contents (20 chapters)
D3.js By Example
Credits
About the Author
About the Reviewers
www.PacktPub.com
Preface
5
Using Data and Scales
Index

Layers


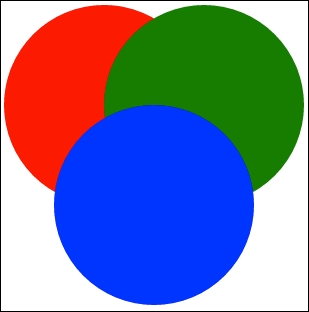
You may have noticed that the SVG elements overlay each other in a particular order, with certain elements appearing to be closer and obscuring those that are behind. Let's examine this using an example that overlays three circles on top of each other:

<circle cx="150" cy="150" r="100" style="fill:red" />
<circle cx="250" cy="150" r="100" style="fill:green" />
<circle cx="200" cy="250" r="100" style="fill:blue" />

Note

bl.ock (3.21): http://goo.gl/hO4xmc

The blue circle is drawn in front of the green circle, which is drawn in front of the red circle. This order is defined by the sequence that is specified in the SVG markup, with each successive element being rendered atop the previous elements.

Note

If you have used other graphics packages or UI tools, you would know that they often provide a concept known as a Z-order, with Z being a pseudo-dimension where the drawing order of the elements is from the lowest to the highest Z-order. SVG does not offer this ability, but...