Book Image

Excel 2010 Financials Cookbook

By : Andre Odnoha
Book Image

Excel 2010 Financials Cookbook

By: Andre Odnoha

Overview of this book

<p>Excel is one of the mostused software tools in the world and just about every business has a copy somewhere. Despite its power and flexibility it is not always clear how to use it to perform some of the most important tasks in any business: organizing, analysing, and presenting financial information.<br /><br />Excel 2010 Financials Cookbook contains a rich collection of useful techniques for handling financial data in Excel. From integrating data from a variety of different sources, through organazing and analyzing financial data, to presenting it in a variety of graphical forms, this book has you covered.<br /><br />The book deals first with "normalizing" financial data -- that is, bringing data from a number of different sources into a single format where you can analyze them together. Then you'll learn techniques for managing and analyzing the data before discovering ways to present it graphically. The book then looks at Excel's built in features for financial analysis, and even shows how you can combine the built in features to build your own analysis functions.</p>
Table of Contents (14 chapters)
Excel 2010 Financials Cookbook
Credits
About the Author
About the Reviewers
www.PacktPub.com
Preface
Index

Adding mini graphs within the data


Similar to the repetition analysis shown earlier in this chapter, visual representation is important to making decisions. However, having the data along with a representation allows for a more complete view of the information, and allows for a more complete decision.

In this recipe, you will learn how to add mini-graph elements to your data to enhance analysis. Although this recipe will utilize a graph element from Excel, the graph is provided in-line to the text, which qualifies this as a non-standard visual element.

How to do it...

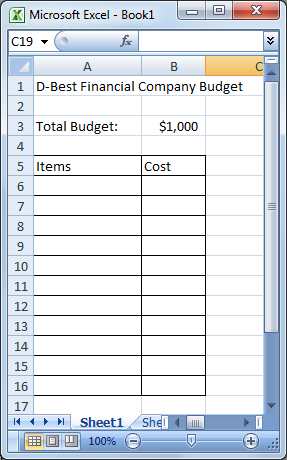
Begin with the data you wish to interpret. In this recipe, we will use a budget sheet for D-Best Financial:

  1. 1. Lay out your Excel chart as shown in the following screenshot:

  2. 2. Select cell C3.

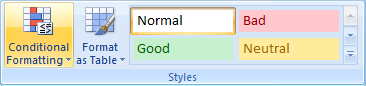
  3. 3. From the Home tab on the Excel ribbon, choose Conditional Formatting | New Rule:

  4. 4. From the New Formatting Rule window, choose the Format all cells based on their values rule:

  5. 5. From the Format Style dropdown, choose Data Bar, select...