

Stem and leaf plots are an invaluable method for charting frequency. While a stem and leaf plot is not a true graph compared to bar graphs, pie charts, and so on, it is still used as a method for graphing/charting the frequency of a data within a population. Financial analysts can use this type of chart to determine inventory levels over a specific date range.
In this recipe, you will learn how to create a stem and leaf plot to chart the number of products sold over the course of several months.
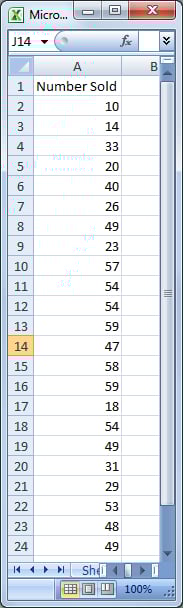
Begin with inventory levels listed in Column A:
We will now need to create the stems. The stems are the first number of the inventory levels (for example, 49 would have stem of 4):
1. Enter the formula =INT(A2/10) into cell C2, and copy down to cell C24 to calculate all of the stems:

We will now create the leaves for the stem and leaf plot. The leaves are the remaining numbers after the stem.
2. In cell D2, enter the formula =MID(A2,LEN(C2)+1,10) and copy...