Book Image

Microsoft Power BI Complete Reference

By : Devin Knight, Brian Knight, Mitchell Pearson, Manuel Quintana, Brett Powell
Book Image

Microsoft Power BI Complete Reference

By: Devin Knight, Brian Knight, Mitchell Pearson, Manuel Quintana, Brett Powell

Overview of this book

Microsoft Power BI Complete Reference Guide gets you started with business intelligence by showing you how to install the Power BI toolset, design effective data models, and build basic dashboards and visualizations that make your data come to life. In this Learning Path, you will learn to create powerful interactive reports by visualizing your data and learn visualization styles, tips and tricks to bring your data to life. You will be able to administer your organization's Power BI environment to create and share dashboards. You will also be able to streamline deployment by implementing security and regular data refreshes. Next, you will delve deeper into the nuances of Power BI and handling projects. You will get acquainted with planning a Power BI project, development, and distribution of content, and deployment. You will learn to connect and extract data from various sources to create robust datasets, reports, and dashboards. Additionally, you will learn how to format reports and apply custom visuals, animation and analytics to further refine your data. By the end of this Learning Path, you will learn to implement the various Power BI tools such as on-premises gateway together along with staging and securely distributing content via apps. This Learning Path includes content from the following Packt products: • Microsoft Power BI Quick Start Guide by Devin Knight et al. • Mastering Microsoft Power BI by Brett Powell
Table of Contents (25 chapters)
Title Page
About Packt
Contributors
Preface
Index

Mobile-optimized dashboards


Just like the phone layout view in Power BI Desktop described in Chapter 11, Creating and Formatting Power BI Reports, the Power BI service provides a phone view to customize a mobile-optimized layout for dashboards. With a phone view configured for a dashboard, the specific tiles, sizes, and order of tiles defined for the phone view will be presented to the user when the dashboard is accessed via the Power BI mobile app on their phone. 

The Phone view can be accessed via the drop-down menu of Web view in the top-right corner of the dashboard, per the following image:

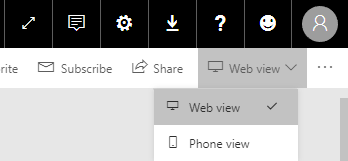
Dashboard Phone view


Once in Phone view, the same drag and resize options available in phone layout for Power BI Desktop are also available for the dashboard. In the following example, the three most important total net sales KPI visuals from the Global Sales dashboard have been positioned at the top of the phone view (Global, North America, Europe) and several less important tiles have been unpinned...