

Power BI is best known for the impressive data visualizations and dashboard capabilities it has. However, before you can begin building reports, you first need to connect to the necessary data sources. Within the Power BI Desktop, a developer has more than 80 unique data connectors to choose from, ranging from traditional file types, database engines, big data solutions, cloud sources, data stored on a web page, and other SaaS providers. This book will not cover all 80 connectors that are available, but it will highlight some of the most popular.
When establishing a connection to a data source, you may be presented with one of three different options on how your data should be treated: Import, DirectQuery, or Live Connection. This section will focus specifically on the Import option.
Choosing to import data, which is the most common option, and default behavior, means that Power BI will physically extract rows of data from the selected source and store it in an in-memory storage engine within Power BI. The Power BI Desktop uses a special method for storing data, known as xVelocity, which is an in-memory technology that not only increases the performance of your query results but can also highly compress the amount of space taken up by your Power BI solution. In some cases, the compression that takes place can even lower the disk space required up to one-tenth of the original data source size. The xVelocity engine uses a local unseen instance of SQL Server Analysis Services (SSAS) to provide these in-memory capabilities.
There are consequences to using the import option within Power BI that you should also consider. These consequences will be discussed later in this chapter, but as you read on, consider the following:
Believe it or not, Excel continues to be the most popular application in the world and as such, you should expect that at some point you will be using it as a data source:
- To get started, open the Power BI Desktop and close the start-up screen if it automatically appears.
- Under the
Homeribbon, you will find thatGet Databutton, which you already learned is used for selecting and configuring data sources. Selecting the down arrow next to the button will show you the most common connectors, but selecting the center of the button will launch the full list of all available connectors. Regardless of which way you select the button, you will find Excel at the top of both lists. - Navigate to and open the file called
AdventureWorksDW.xlsxfrom the book resources. This will launch theNavigatordialog, which is used for selecting the objects in the Excel workbook you desire to take data from:
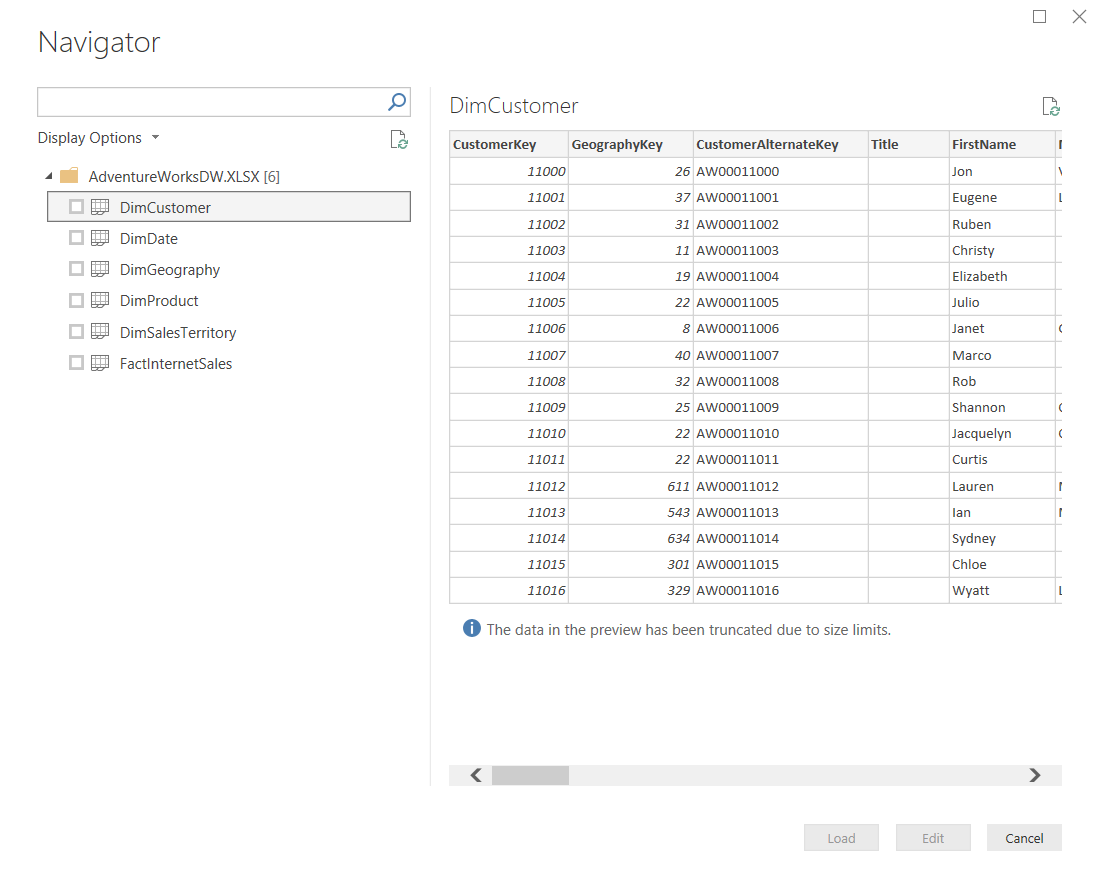
- In this example, you see six separate spreadsheets you can choose from. Clicking once on the spreadsheet name will give you a preview of the data it stores, while clicking the checkbox next to the name will include it as part of the data import. For this example, select the checkboxes next to all of the available objects, then notice the options available in the bottom right.
- Selecting
Loadwill immediately take the data from the selected spreadsheets and import them as separate tables in your Power BI data model. ChoosingEditwill launch an entirely new window called thePower Query Editorthat allows you to apply business rules or transforms to your prior to importing it. You will learn much more about thePower Query Editorin Chapter 2, Data Transformation Strategies. Since you will learn more about this later, simply selectLoadto end this example.
Another topic you will learn more about in Chapter 6, Using a Cloud Deployment with the Power BI Service, is the concept of data refreshes. This is important because, when you import data into Power BI, that data remains static until another refresh is initiated. This refresh can either be initiated manually or set on a schedule. This also requires the installation of a Data Gateway, the application in charge of securely pushing data into the Power BI Service. Feel free to skip to Chapter 6, Using a Cloud Deployment with the Power BI Service, if configuring a data refresh is a subject you need to know now.
Another common source designed for relational databases is Microsoft SQL Server:
- To connect to SQL Server, select the
Get Databutton again, but this time chooseSQL Server. Here, you must provide the server, but the database is optional and can be selected later:
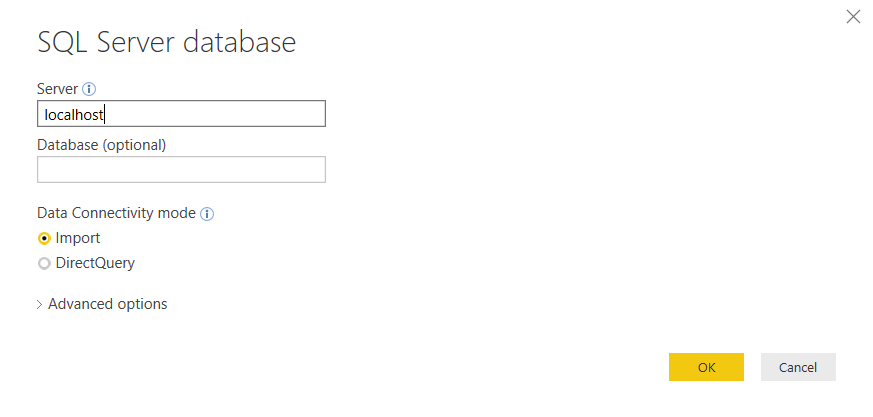
- For the first time, you are asked to choose the type of
Data Connectivity modeyou would like. As mentioned previously,Importis the default mode, but you can optionally selectDirectQuery. DirectQuery will be discussed in greater detail later in this chapter. Expanding theAdvancedoptions provides a way to insert a SQL statement that may be used as your source. For the following example, in the server is the only one property populated before clickingOK:
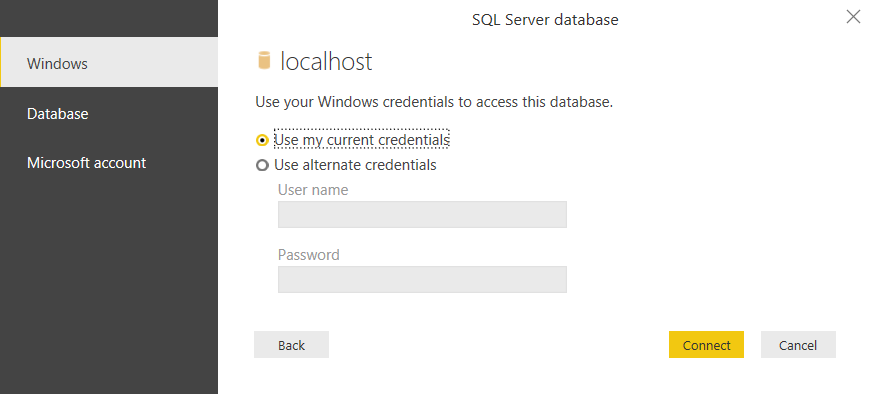
- Next, you will be prompted to provide the credentials you are using to connect to the database server you provided on the previous screen.
- Click
Connectafter providing the proper credentials to launch the sameNavigatordialog that you may remember from when you connected to Excel. Here, you will select the tables, views, or functions within your SQL Server database that you desire to import into your Power BI solution. Once again, the final step in this dialog allows you to choose to eitherLoadorEditthe results.
One pleasant surprise to many Power BI Developers is the availability of a web connector. Using this connection type allows you to source data from files that are stored on a website or even data that has been embedded into an HTML table on the web page. Using this type of connector can often be helpful when you would like to supplement your internal corporate data sources with information that can be publicly found on the internet.
For this example, imagine you are working for a major automobile manufacturer in the United States. You have already designed a Power BI solution using data internally available within your organization that shows historical patterns in sales trends. However, you would like to determine whether there are any correlations in periods of historically higher fuel prices and lower automobile sales. Fortunately, you found that the United States Department of Labor publicly posts historical average consumer prices of many commonly purchased items, including fuel prices.
- Now that you understand the scenario within the Power BI Desktop, select the
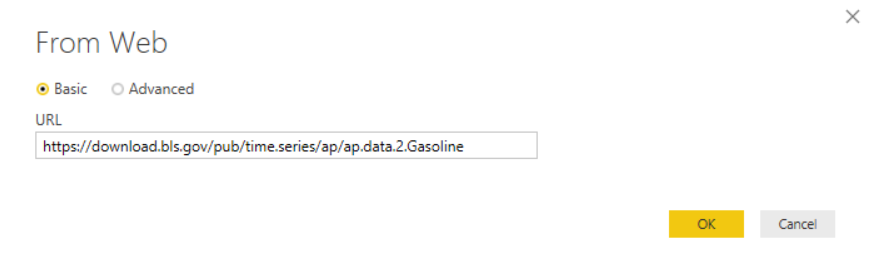
Get Databutton and chooseWebas your source. You will then be prompted to provide the URL where the data can be found. In this example, the data can be found by searching on the website Data.Gov (https://www.data.gov/) or, to save you some time, use the direct link: https://download.bls.gov/pub/time.series/ap/ap.data.2.Gasoline. Once you provide the URL, clickOK:
- Next, you will likely be prompted with an
Access Web Contentdialog box. This is important when you are using a data source that requires a login to access. Since this data source does not require a login to find the data, you can simply select anonymous access, which is the default, and then clickConnect:
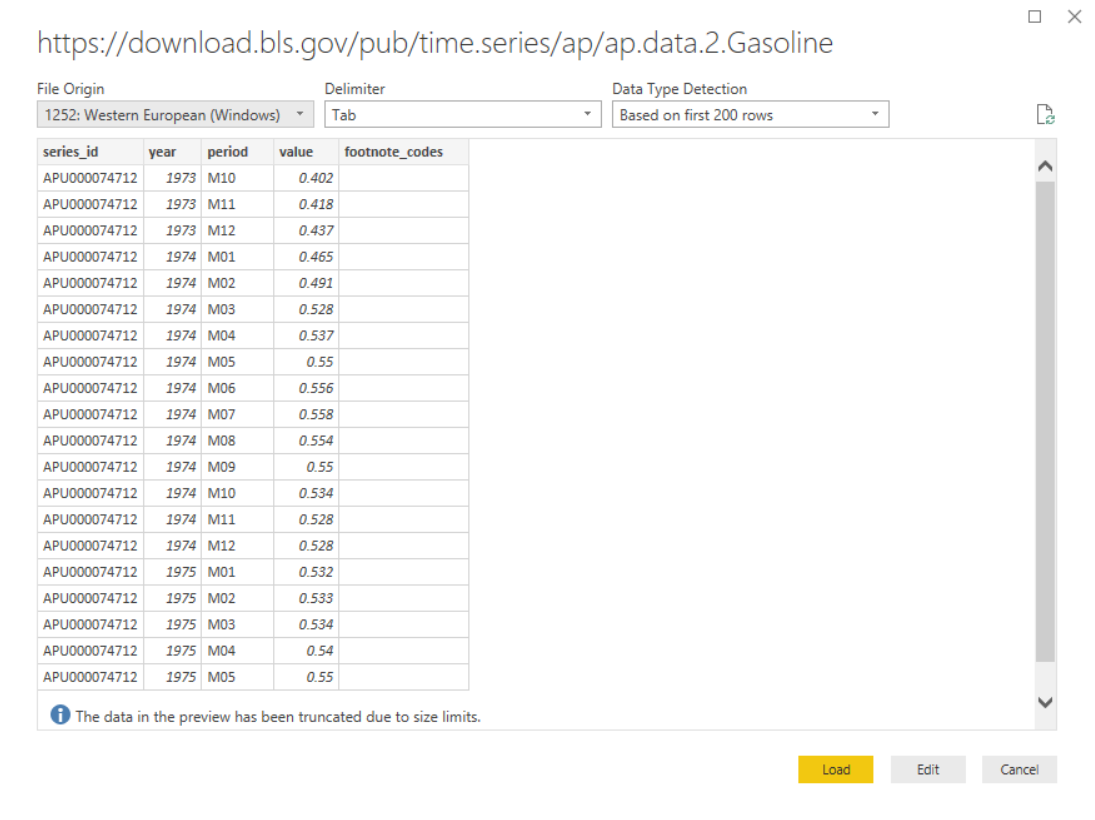
Notice on the next screen that the Power BI Desktop recognizes the URL provided as a tab-delimited file that can now easily be added to any existing data model you have designed.