

One of the most useful features that came out in Xcelsius 2008 SP3 was the scorecard component. With the scorecard component, we are able to easily create scorecard KPIs with the ability to insert a user desired alert/trending icon in any column of the scorecard.
Before the advent of the scorecard component, developers would have to use either a Listview selector or Spreadsheet Table selector, and then overlay a Label Based Menu selector or individual alert/trend icons in each column that required alerting/trending.
This was a huge hassle, as developers had to use a major workaround in order to implement the commonly used scorecard feature.
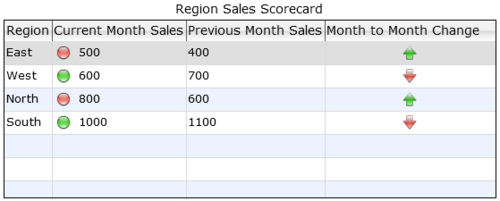
In this recipe, we will go through an example of using the scorecard component to show a table of values, a threshold indicator that will determine if the current months sales meets the threshold or not, and a trend indicator that shows if the current month sales has risen/fallen compared to the previous month sales.