

The grid component can display a table with data in your dashboard. Therefore it looks a bit like the list view and spreadsheet table components. There are a number of differences between these two sets of components, stated as follows:
The list view and spreadsheet table components allow us to make data selections; the grid component does not
The grid component not only displays data, but its values can also be changed by the dashboard user
The grid component doesn't have a header row
The grid component has the option to make use of alerts
Open a new dashboard design file and enter the values in the spreadsheet as shown in the following screenshot:
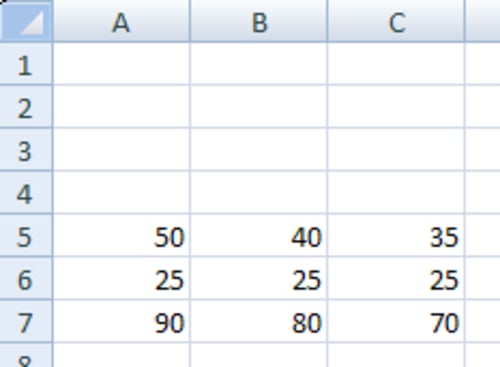
Bind the Data field to spreadsheet cells A5 until C7.
Go to the Behavior tab and set the Increment to
5.Click on the Appearance tab. Set the Vertical Margin as well as the Horizontal Margin to 5.
Resize the canvas container component to almost half the same size...