Book Image

The Data Warehouse Toolkit - Third Edition

By : Ralph Kimball, Margy Ross
Book Image

The Data Warehouse Toolkit - Third Edition

By: Ralph Kimball, Margy Ross

Overview of this book

The volume of data continues to grow as warehouses are populated with increasingly atomic data and updated with greater frequency. Dimensional modeling has become the most widely accepted approach for presenting information in data warehouse and business intelligence (DW/BI) systems. The goal of this book is to provide a one-stop shop for dimensional modeling techniques. The book is authored by Ralph Kimball and Margy Ross, known worldwide as educators, consultants, and influential thought leaders in data warehousing and business intelligence. The book begins with a primer on data warehousing, business intelligence, and dimensional modeling, and you’ll explore more than 75-dimensional modeling techniques and patterns. Then you’ll understand dimension tables in-depth to get a good grip on retailing and moved towards the topics of inventory. Moving ahead, you’ll learn how to use this book for procurement, order management, accounting, customer relationship management, and many more business sectors. By the end of this book, you’ll be able to gather all the essential knowledge, practices, and patterns for designing dimensional models.
Table of Contents (31 chapters)
Free Chapter
1
Cover
2
Title Page
3
Copyright
4
About the Authors
5
Credits
6
Acknowledgements
29
Index
30
Advertisement
31
End User License Agreement

Consolidated Fact Tables

In the last section, we discussed comparing metrics generated by separate business processes by drilling across fact tables, such as budget and commitments. If this type of drill-across analysis is extremely common in the user community, it likely makes sense to create a single fact table that combines the metrics once rather than relying on business users or their BI reporting applications to stitch together result sets, especially given the inherent issues of complexity, accuracy, tool capabilities, and performance.

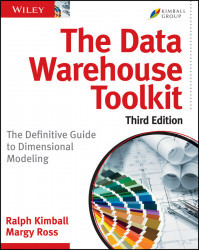
Most typically, business managers are interested in comparing actual to budget variances. At this point, you can presume the annual budgets and/or forecasts have been broken down by accounting period. Figure 7-19 shows the actual and budget amounts, as well as the variance (which is a calculated difference) by the common dimensions.

image

Figure 7-19: Actual versus budget consolidated fact table.

Again, in a multinational organization, you would likely...