

In this recipe, we will go through the basics of connecting to a data source. The first step you must take when you open Tableau, before you create any visualizations, is to connect to a data source. You will then use that data source to create your views and dashboards.
Connecting to the data
Getting ready
In this recipe, we will be using the Baby_names.csv dataset. Make sure that you have a local copy of the dataset saved to your device.
How to do it...
- Open Tableau.
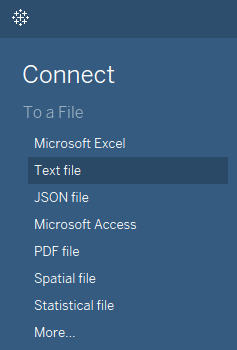
- From the Connect pane on the left-hand side, choose the Text file option:
- A new window will open. Navigate to your local copy of the Baby_names.csv dataset, select it, and click Open.
- Tableau has now opened the Data Source page for you, where the file you loaded has been selected as the data source, and where you can also preview it.
- To begin making your first visualization, just click on the Sheet 1 tab in the bottom of the workbook.
You are all set!
How it works...
Tableau reads the file you connected to and recognizes fields and their respective data types. There are the following data types in Tableau:
- Number (decimal)
- Number (whole)
- Date and time
- Date
- String
- Boolean
After you have connected to the data source and you click on Sheet 1, you will see the Data pane on the left-hand side of the workspace, with all the fields from the data source listed, and their respective types marked by small symbols to the left of their names, as shown in the following screenshot:
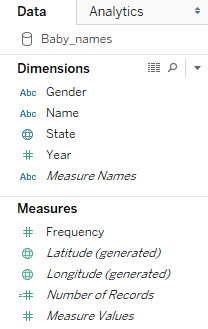
The globe symbols in front of State, Longitude, and Latitude denotes the geographical roles of these fields, which are important when building maps. On the other hand, the Abc symbol signifies strings, while the # symbol denotes numerical values.
There's more...
Tableau allows users to connect to a wide range of data. You can connect to different types of files that are stored locally on your device, or data stored on the cloud or in relational or multidimensional databases. You can connect to the list of data that is available on the Start page, which opens when you launch Tableau Desktop, under Connect.
See also
- For more on connecting to data, see the Tableau help resource on the topic at https://onlinehelp.tableau.com/current/pro/desktop/en-us/basicconnectoverview.html