Sign In Start Free Trial
Account

Add to playlist

Create a Playlist

Modal Close icon
You need to login to use this feature.
  • Book Overview & Buying Python Feature Engineering Cookbook
  • Table Of Contents Toc
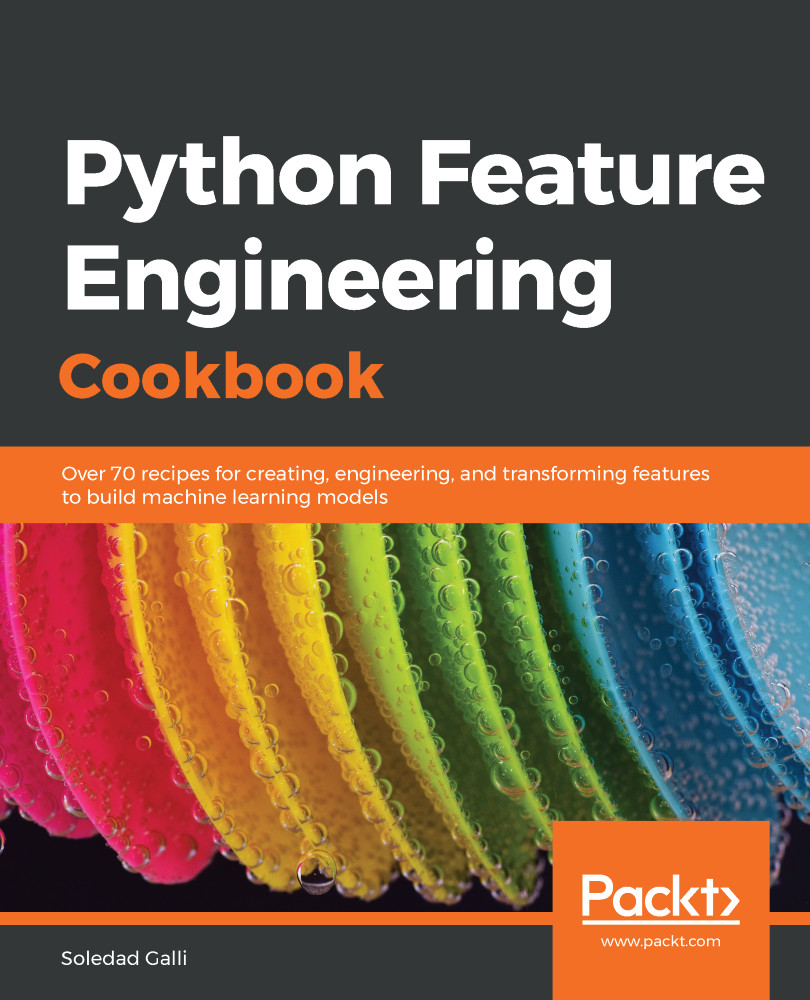
Python Feature Engineering Cookbook

Python Feature Engineering Cookbook

By : Soledad Galli
3.6 (9)
close
close
Python Feature Engineering Cookbook

Python Feature Engineering Cookbook

3.6 (9)
By: Soledad Galli

Overview of this book

Feature engineering is invaluable for developing and enriching your machine learning models. In this cookbook, you will work with the best tools to streamline your feature engineering pipelines and techniques and simplify and improve the quality of your code. Using Python libraries such as pandas, scikit-learn, Featuretools, and Feature-engine, you’ll learn how to work with both continuous and discrete datasets and be able to transform features from unstructured datasets. You will develop the skills necessary to select the best features as well as the most suitable extraction techniques. This book will cover Python recipes that will help you automate feature engineering to simplify complex processes. You’ll also get to grips with different feature engineering strategies, such as the box-cox transform, power transform, and log transform across machine learning, reinforcement learning, and natural language processing (NLP) domains. By the end of this book, you’ll have discovered tips and practical solutions to all of your feature engineering problems.
Table of Contents (13 chapters)
close
close

Removing observations with missing data

Complete Case Analysis (CCA), also called list-wise deletion of cases, consists of discarding those observations where the values in any of the variables are missing. CCA can be applied to categorical and numerical variables. CCA is quick and easy to implement and has the advantage that it preserves the distribution of the variables, provided the data is missing at random and only a small proportion of the data is missing. However, if data is missing across many variables, CCA may lead to the removal of a big portion of the dataset.

How to do it...

Let's begin by loading pandas and the dataset:

  1. First, we'll import the pandas library:
import pandas as pd
  1. Let's load the Credit Approval Data Set:
data = pd.read_csv('creditApprovalUCI.csv')
  1. Let's calculate the percentage of missing values for each variable and sort them in ascending order:
data.isnull().mean().sort_values(ascending=True)

 The output of the preceding code is as follows:

A11    0.000000
A12    0.000000
A13    0.000000
A15    0.000000
A16    0.000000
A4     0.008696
A5     0.008696
A6     0.013043
A7     0.013043
A1     0.017391
A2     0.017391
A14    0.018841
A3     0.133333
A8     0.133333
A9     0.133333
A10    0.133333
dtype: float64
  1. Now, we'll remove the observations with missing data in any of the variables:
data_cca = data.dropna()
To remove observations where data is missing in a subset of variables, we can execute data.dropna(subset=['A3', 'A4']). To remove observations if data is missing in all the variables, we can execute data.dropna(how='all').
  1. Let's print and compare the size of the original and complete case datasets:
print('Number of total observations: {}'.format(len(data)))
print('Number of observations with complete cases: {}'.format(len(data_cca)))

Here, we removed more than 100 observations with missing data, as shown in the following output:

Number of total observations: 690
Number of observations with complete cases: 564

We can use the code from step 3 to corroborate the absence of missing data in the complete case dataset.

How it works...

In this recipe, we determined the percentage of missing data for each variable in the Credit Approval Data Set and removed all observations with missing information to create a complete case dataset.

First, we loaded the data from a CSV file into a dataframe with the pandas read_csv() method. Next, we used the pandas isnull() and mean() methods to determine the percentage of missing observations for each variable. We discussed these methods in the Quantifying missing data recipe in Chapter 1, Foreseeing Variable Problems When Building ML Models. With pandas sort_values()we ordered the variables from the one with the fewest missing values to the one with the most.

To remove observations with missing values in any of the variables, we used the pandas dropna() method, thereby obtaining a complete case dataset. Finally, we calculated the number of observations we removed using the Python built-in method len, which returned the number of rows in the original and complete case datasets. Using format, we included the len output within the {} in the print statement, thereby displaying the number of missing observations next to the text.

See also

CONTINUE READING
83
Tech Concepts
36
Programming languages
73
Tech Tools
Icon Unlimited access to the largest independent learning library in tech of over 8,000 expert-authored tech books and videos.
Icon Innovative learning tools, including AI book assistants, code context explainers, and text-to-speech.
Icon 50+ new titles added per month and exclusive early access to books as they are being written.
Python Feature Engineering Cookbook
notes
bookmark Notes and Bookmarks search Search in title playlist Add to playlist download Download options font-size Font size

Change the font size

margin-width Margin width

Change margin width

day-mode Day/Sepia/Night Modes

Change background colour

Close icon Search
Country selected

Close icon Your notes and bookmarks

Confirmation

Modal Close icon
claim successful

Buy this book with your credits?

Modal Close icon
Are you sure you want to buy this book with one of your credits?
Close
YES, BUY

Submit Your Feedback

Modal Close icon
Modal Close icon
Modal Close icon