Book Image

Tableau 10 Complete Reference

By : Joshua N. Milligan, Tristan Guillevin
Book Image

Tableau 10 Complete Reference

By: Joshua N. Milligan, Tristan Guillevin

Overview of this book

Graphical presentation of data enables us to easily understand complex data sets. Tableau 10 Complete Reference provides easy-to-follow recipes with several use cases and real-world business scenarios to get you up and running with Tableau 10. This Learning Path begins with the history of data visualization and its importance in today's businesses. You'll also be introduced to Tableau - how to connect, clean, and analyze data in this visual analytics software. Then, you'll learn how to apply what you've learned by creating some simple calculations in Tableau and using Table Calculations to help drive greater analysis from your data. Next, you'll explore different advanced chart types in Tableau. These chart types require you to have some understanding of the Tableau interface and understand basic calculations. You’ll study in detail all dashboard techniques and best practices. A number of recipes specifically for geospatial visualization, analytics, and data preparation are also covered. Last but not least, you'll learn about the power of storytelling through the creation of interactive dashboards in Tableau. Through this Learning Path, you will gain confidence and competence to analyze and communicate data and insights more efficiently and effectively by creating compelling interactive charts, dashboards, and stories in Tableau. This Learning Path includes content from the following Packt products: • Learning Tableau 10 - Second Edition by Joshua N. Milligan • Getting Started with Tableau 2018.x by Tristan Guillevin
Table of Contents (20 chapters)
Title Page
About Packt
Contributors
Preface
8
Deeper Analysis - Trends, Clustering, Distributions, and Forecasting
Index

Understanding how formatting works in Tableau


Tableau uses default formatting that includes default fonts, colors, shading, and alignment. Additionally, there are several levels of formatting you can customize, as shown in the following diagram:

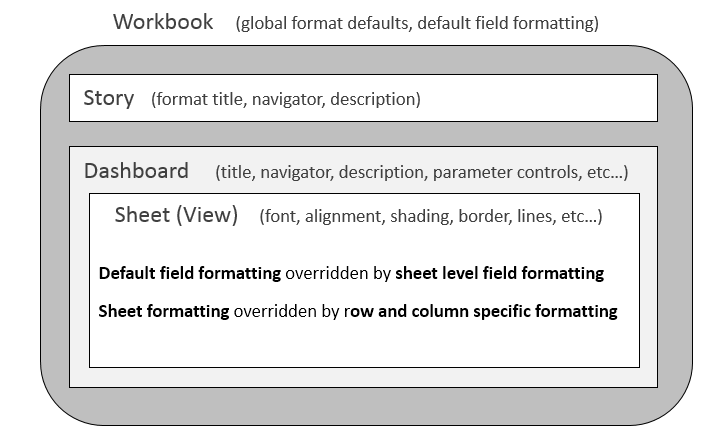
  • Workbook level: The following type of formatting comes under this category:
    • Workbook defaults: from the menu, select Format|Workbook. The ability to set certain formatting as the default for the workbook is new to Tableau 10.
    • Default field formatting: Using the drop down menu on a field in the data pane, navigate to Default Properties | Date Format or Default Properties | Number Format. This sets the default format in Tableau's metadata and will be applied to any view where custom formatting has not been applied.
  • Story level: Navigate to a story tab and navigate to Format | Story (or Story | Format) to edit formatting for story specific elements. These include options for customizing shading, title, navigator, and description.
  • Dashboard level: Dashboard...