
Extending the Tableau data model with calculations, folders, hierarchies, grouping, and descriptions
When creating data models, Tableau allows us to extend and enhance our models for easier and more robust analysis by adjusting the metadata in the model and adding calculations. Let's create a calculation for Profit Margin %:
- Open Tableau Desktop. From the connect pane, under the To a File section, select Text file. Locate the
Superstore Sales 2022.csvfile and click Open. Click on Sheet 1. Right-click onProfitand select Create | Calculated Field from the menu, as seen in Figure 10.24:
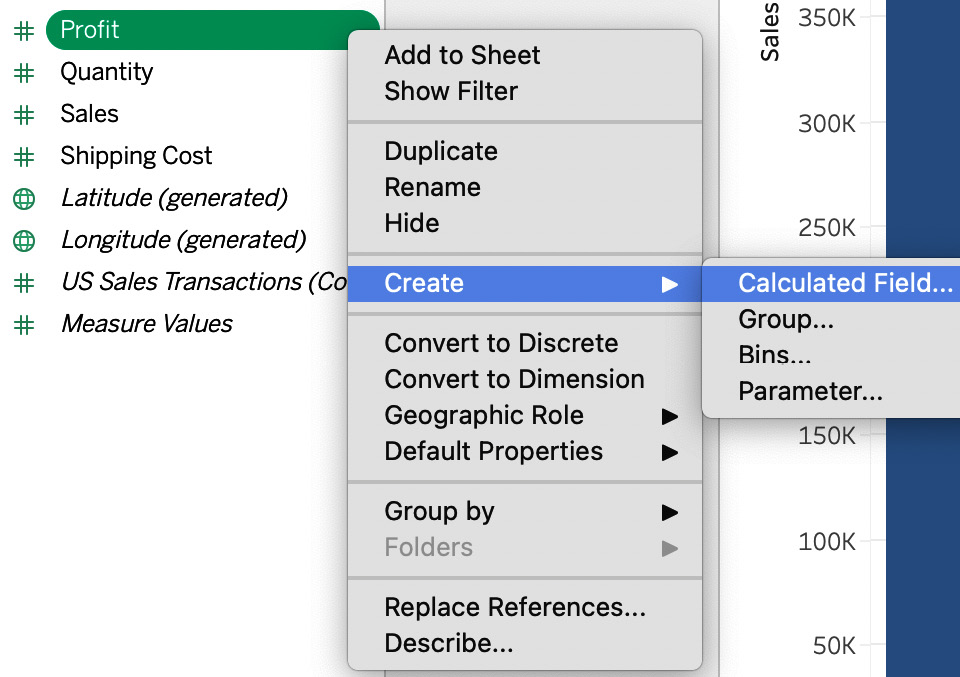
Figure 10.24 – Creating a calculated field
- In the calculation dialog box, give your calculation the name
Profit Margin %and enterSUM(Profit)/SUM(Sales)as seen in Figure 10.25. Then, click OK to finish creating the calculated field:
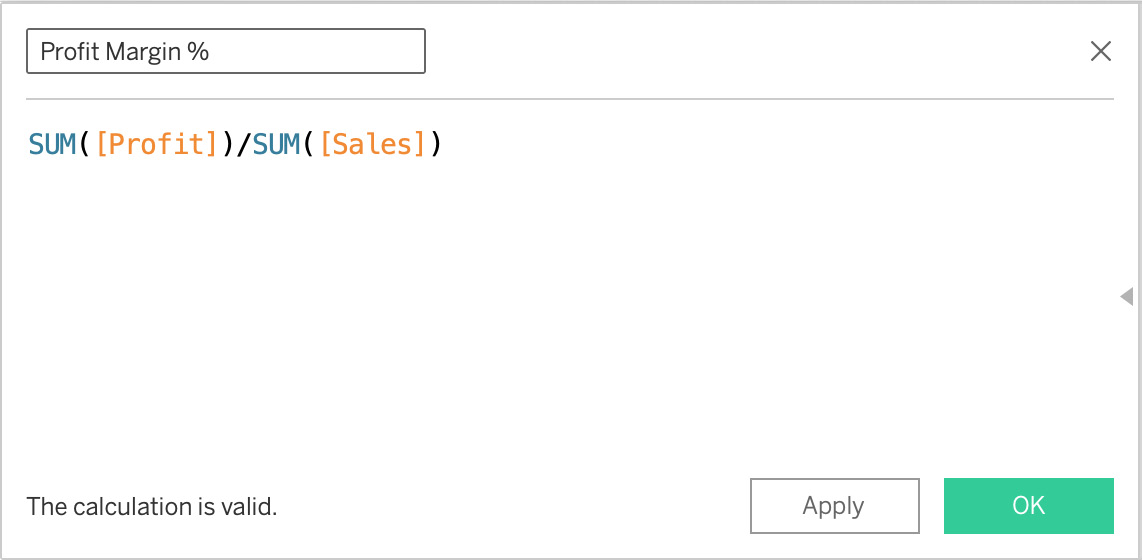
Figure 10.25 – Calculated field