
Data catalog, data lineage, data quality warnings, and certified data sources
In addition to Tableau Prep Conductor, Tableau Data Management also enables three other features, namely, data catalog, lineage, and data quality warnings. In this section, we will look at each of these features:
- From the same Tableau Server or Cloud instance we used in the previous exercise, click on the Explore navigation button on the left-hand side panel. If the side panel is collapsed, the Explore button will look similar to what’s shown in Figure 13.16:
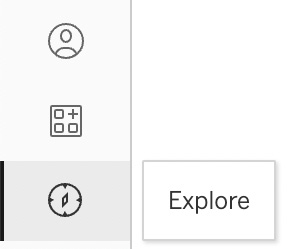
Figure 13.16 – The Explore button
- Click on the link for the Sales project. You should now see the Canada Sales published data source and Canada Sales Flow, which we created in the previous exercise, as shown in Figure 13.17:
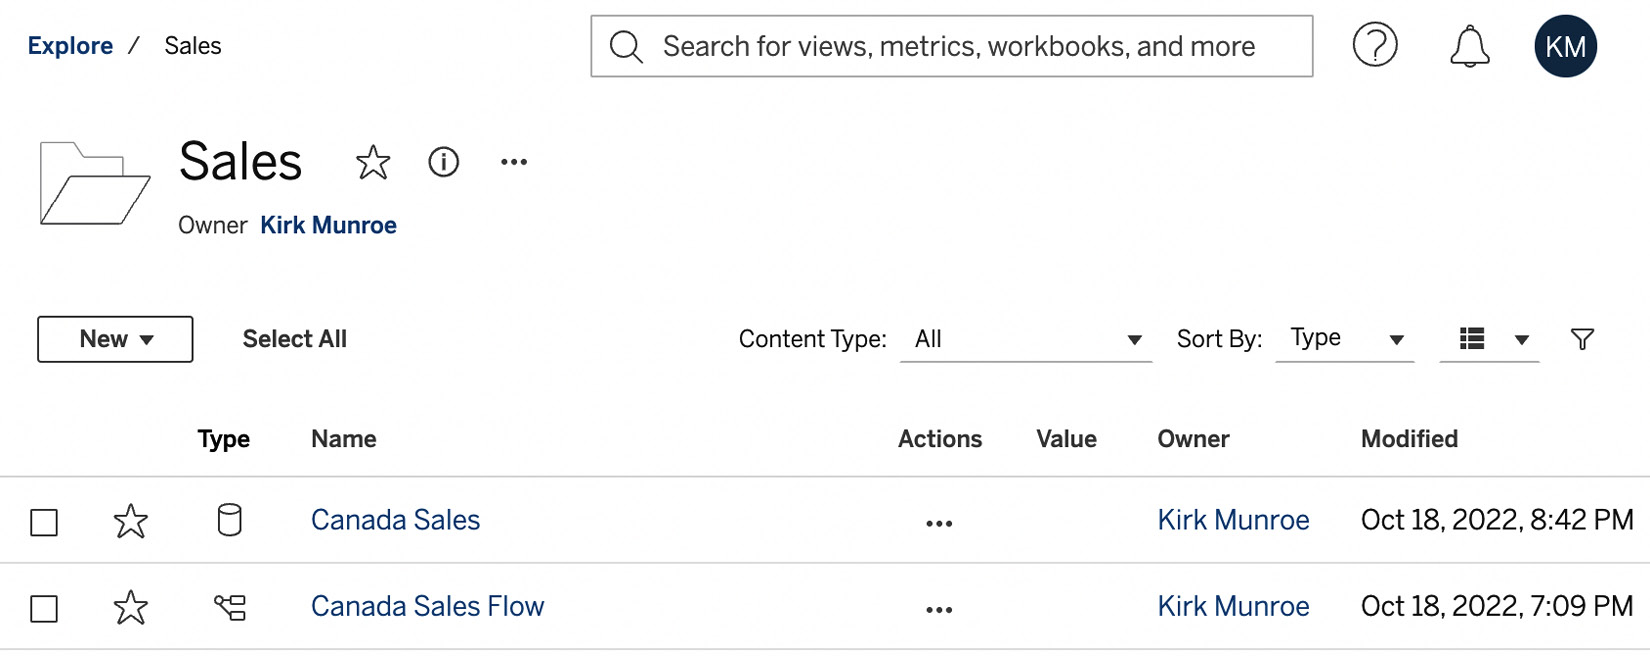
Figure 13.17 – Sales project contents