

The ideal data format for Tableau – table format
Tableau performs best and is easiest to use when every column in the source data corresponds to a single field and each row represents a record of data at the lowest level required for analysis. As you can see in the following screenshot (Figure 1.5), Tableau will put all the field names in columns, including the type of each field. This is the metadata in your data model. Every row below the row of field headers will contain data, with each row representing one record of data:
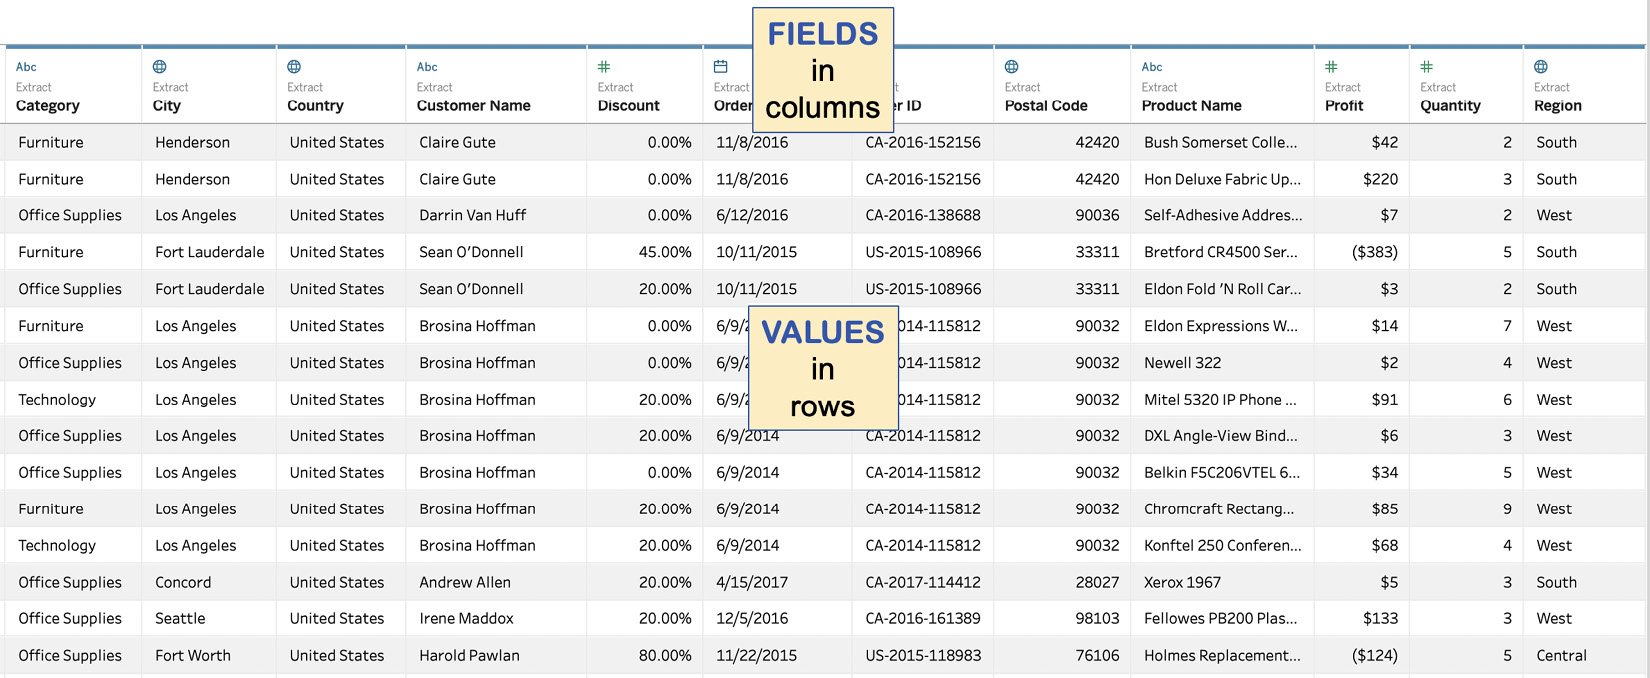
Figure 1.5 – The Tableau data format
When data is structured in this manner, it allows Tableau to perform optimally based on query performance, the ease of building analyses, and combining data from different sources.
Tableau will automatically assume your data is stored this way when you connect to a new data source. We saw this in the previous exercise. Tableau took the first row from the comma-separated values file and used it to create field names, restarting after the comma separator. Next, Tableau assumed after the first carriage return that the second row would be a row of values, neatly falling into the columns above it. For each additional carriage return, Tableau assumed another data record.
It turned out that Tableau was right in the assumptions it made. Data prepared for analysis is often already stored in this format, with each row being a unique record of data, separated into individual fields based on fields in database tables or headings in flat files and Excel.
What happens when it isn’t? This puts an analyst in the position of creating more complicated analyses (calculations, sheets, dashboards, and stories) and query performance almost always suffers.
In the next section, we will look at one of the most common ways where we see data structured in a manner that is not Tableau-friendly.