Financial Modeling and Reporting with Microsoft Power BI is the definitive guide to designing high-performance, flexible, and insightful financial reports using Power BI. This Power BI book empowers finance and BI professionals to create everything from trial balances to enterprise-wide performance dashboards with ease and precision.
The book starts by helping you define your reporting goals and data sources, mapping these needs to Power BI’s capabilities. You’ll then build a core financial data model—covering ledger transactions, charts of accounts, and multi-company support. As you proceed, you’ll integrate complex DAX measures, handle foreign exchange and journal entries, and extend your model with budgeting and inventory data.
Each chapter builds toward a comprehensive suite of reports, complete with visual best practices and tested metrics. You’ll learn to streamline datasets using Power Query, test for data integrity, and generate printable reports via Power BI Paginated. The final chapters dive into using AI, predictive analytics, and Microsoft Fabric to future-proof your reporting.
Whether you're consolidating data across systems or evolving your reports for changing business needs, this hands-on guide ensures you’re prepared to meet the demands of modern finance.
Setting project scope is fundamental to the success of any project; a Power BI implementation is no different. A project's scope is far bigger than the list of reports you want to produce; it defines every aspect of the project. A good project scope should set a budget, a timeframe, and resources, and then be communicated to and agreed upon by the project team. Once signed off, the project scope should be the operating manual for the project. Yes, it'll more than likely change as the project progresses, and scope change needs to be part of the project scope.
To put this in context, let's look at a common path of Power BI adoption to understand why project scope is important.
The start of many Power BI projects is a curious employee with a business problem, data, and a free Power BI Desktop download. There's a particular report that needs to be produced, or the individual wants to impress their manager. Fast-forward via ad hoc online learning, some attractive interactive visuals, and an excited data-oriented executive, and interest is sparked in an organization. Power BI is the "thing" to use, and one curious employee will become many curious employees as they dip their toes into the water of this new and exciting tool. Many Power BI fires will be lit around the organization, and PBIX files will be frequently emailed around it.
This is a common form of adoption. Everyone is excited and wants to be on board. Many people are using Power BI, albeit in a self-learned and uncoordinated manner.
Then, reports start to show cracks, there are issues with incorrect data, and no one is certain about which Power BI file (PBIX) in their inbox is current. Confidence starts to wane, and Power BI falls into limited use. To be safe, many users return to their tried and trusted best friend, Excel.
There are common elements to this form of technical adoption that cause issues:
Untrained/self-trained employees using a complex product and introducing errors.
A lack of understanding of how to deploy Power BI via the Power BI Service, treating it like any other file-based application. Therefore, reporting is distributed via email or OneDrive/SharePoint/file shares.
No version control garners uncertainty about which file to use. The organization has many versions, many of which are, generally imperceptibly, slightly different from each other.
In some organizations, the Power BI project may be saved by an experienced member of the IT team who has been here before, recognizes the signs, and realizes that a properly formed project will save the day. There's nothing wrong with the technology and its capability to meet once-heady expectations. If the organization follows the basics of IT project management, the technology will deliver.
In other cases, cognitive dissonance sets in as people within the organization wrestle with the contradiction that the tool that promised so much is not delivering on once-elevated expectations.
It won't surprise you that we don't recommend the approach outlined, as we often work with organizations that have been through a variant of the aforementioned situation. That said, it sometimes takes a curious employee to introduce new thinking into some organizations, so we can't pretend to be completely opposed. In reality, the reasons that drove the organization to Power BI are all completely valid; the technology is capable of everything first envisaged, and in most cases, much more.
As mentioned in the previous section, Power BI involves a mix of disciplines and processes, and the start of any well-executed project is proper scoping. Even if the genesis of the project is the curious employee, it's important for the organization to take control of the implementation and adoption process.
Proper scoping follows a process to understand and structure the reporting requirements within the finance function. Power BI projects are inherently complex with multiple moving parts, and a project scope is far more than a list of required reports. It's an articulation of all aspects of the project that should inform anyone new to the project about the requirements, purpose, and process to deliver success, including a definition of what success looks like.
There's an abundance of material available on IT project scoping that we don't want to repeat here, as the length of the book will quickly grow, but we wanted to document a concise scoping process that's focused on a successful Power BI project within a finance function.
We urge all organizations to have some level of education on Power BI to understand its capabilities. Power BI, like all products, has strengths and weaknesses, so it's useful to understand the product, its features, and what best practice use looks like in a few similar organizations. This will set the tone for the project scoping and stop requests for capabilities outside of Power BI's functionality.
This can be completed in a half-day workshop with a consultant expert in Power BI who has relevant expertise and the ability to explain the concepts to a lay audience.
After an education session, here's a simple checklist you can work through to scope your Power BI project.
Setting clear goals and objectives
You should agree, in simple terms, on the purpose of the project, with some clear goals and objectives. This is more specific than "Implement Power BI in Finance," although that could be an overall name for the project. Your goals will be broad intentions, and your objectives should be specific and measurable. It's common to link goals and objectives, so there's a clear correlation between the broad intention of the goal and the specifics of the objective. Here are some examples:
Goal: Enhance financial reporting efficiency
Objectives:
Within 6 months, all standard finance reports will be capable of being run daily without the need for human intervention.
Create Power BI dashboards that cover key financial metrics such as revenue, expenses, and profit margins within the next six months.
Goal: Improve stakeholder satisfaction with the quality of financial reporting
Objectives:
80% satisfaction rating from report stakeholders based on a standard qualitative and quantitative survey to be run every 3 months.
Scores less than 80% to be investigated with corrective plans implemented to maintain an over 80% score.
A half-to-one-day workshop with the project team's core members is a great way to brainstorm through goals. We recommend an experienced facilitator who can guide the team through the process, avoiding the inevitable rabbit-holes that are often entered during the discussions and consume valuable hours. It's important to get the goals and objectives written and circulated quickly for agreement.
Goals and objectives should be easily understood, using clear and concise language that is common parlance for the culture of the organization.
Detailed scoping – list of reports to create
Part of the evaluation is an inventory of the reports you currently have in place and why they're not providing the insights you need. This will help identify the gaps in functionality and what needs to be developed. You'll likely see common themes with the gaps, such as a lack of flexibility, missing information, and having to export to Excel to provide the detail required by the organization.
With the inventory of standard reports, you'll likely see three trends:
Standard accounting reports that may/may not need reproducing in Power BI: We don't always suggest that a client reproduces everything in Power BI. Reporting in most financial applications generally has value and many reports should continue to be used, especially detailed transactional reports that are refreshed each time they are run (real-time transactional reporting is not the best use of Power BI).
Reports provided by the accounting application that are not meeting the needs of the business, and are generally exported and manipulated.
Reports required by the organization, identified by the goals and objectives, missing from currently available reports. These may be currently generated through manual effort.
Against this backdrop, also consider the reporting capabilities you want from Power BI, such as slicers – allowing users to interactively filter data, drillthrough – giving access to the details that underly the measures, and buttons – to aid navigation, to name a few. The specification of a report should be about much more than data; think of your reports as applications with functionality to help improve interactivity with the users.
Once you have a list of reports, we recommend that you prioritize report development. The delivery of new reports can take some time, and the start of a Power BI project will see an organization with demand akin to drinking from a fire hydrant. It's impossible to meet all demand on day 1, and whoever shouts the loudest isn't a good method to determine the order of development. A useful tool in this prioritization is the MoSCoW method:
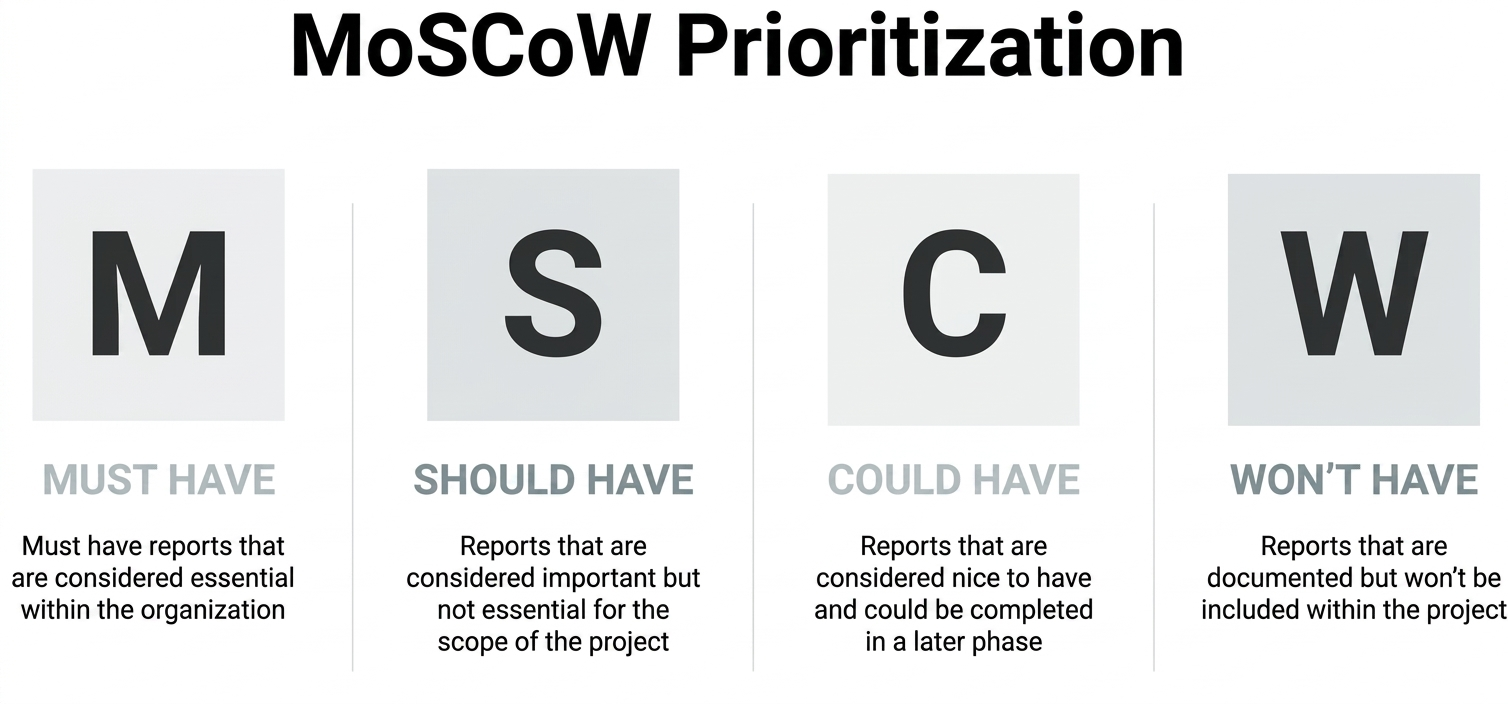
Figure 1.1: The MoSCoW prioritization method
The MoSCoW method is a commonly used technique to prioritize requirements or tasks in project management and software development. It also works well for Power BI during the scoping phase. It helps stakeholders understand the importance and urgency of each item to ensure that the most critical tasks are completed first. The acronym MoSCoW stands for the following:
Must have:
These are the most critical reports that are non-negotiable to deliver the goals and objectives set in the previous exercise. These may not be the reports that form statutory reporting or deliver basic accounting processes, such as trial balance, as these may come from your accounting application, and you may choose to maintain them there.
Should have:
These are important reports that will add significant value but may not meet the project's goals. These reports can be assigned to phase 2 of the project, after the must-have reports have been delivered.
Could have:
These are desirable but not necessary reports. They are considered nice-to-haves and can be included if time and resources permit or possibly pushed back to a long-term maintenance project.
Won't have (this time):
These are reports that have been agreed to be postponed or left out of the project's scope. They are worth capturing as they may be considered for future releases or projects.
MoSCoW sessions are often run as brainstorms where the project team lists everything, then categorizes the results of the brainstorm into the four buckets. This isn't always easy, especially for should-have and could-have reports, as the differences between them may cause disagreement.
When working on Power BI implementations, we generally work to a 90/10 rule. 90% of our time is spent building data models, and 10% of our time is spent on the reports and visualizations our users interact with daily. That sometimes seems strange when we first introduce the concept to our customers. Why is so little time spent on the part users interact with daily? The reason is simple: when we get the data model structure and measures correct, and we know the list of reports required, the visuals are relatively easy. That's why the report list prepared in this section is so important. It means we know what the data model(s) need to contain to support the required reports.
It's worth consulting with your Power BI developers once the MoSCoW prioritization has been completed, as some should-have or could-have reports may be derivatives of the must-have reports and could be easily accommodated because of the work scheduled to deliver them. Developers are especially prone to the negative effects of task switching, and an extra hour to build measures for a should-have report while engaged on the model can easily turn into 2-3 hours if asked to break the workflow for a few weeks or months. We appreciate that this may contradict some of our advice for prioritization, as you could end up delivering a could-have report before a should-have, but you may choose to be practical and cost-effective with resources.
Report standards
As Power BI allows users to be creative with report design, we advise that standards are set for all reports at an early stage, so reports have a common user interface. A Power BI project shouldn't be an opportunity for the free artistic expression of each report developer. It's a business project, not an art class. Standards make it easier for users to work with the reports as they'll conform to a common look and feel. Users will understand new reports, and new employees will be able to quickly learn corporate standards. We advise that you consider the following:
Layout of your reports:Adopt a consistent layout with user interface elements. To some extent, Power BI reports should be considered similar to apps, as there are capabilities that provide functionality such as filtering and drillthrough. It's important to use these consistently so users know what to look for and where in the report. The layout of a report should not be governed by the person who built the report, as you'll end up with a myriad of different report styles that'll confuse your users.
Color scheme and branding: Our general advice is to use corporate branding color schemes for your reporting. Assign colors to user interface elements so they are consistent and easy to recognize by your users.
Naming conventions: Names should be obvious and descriptive for the end user.
We've seen many examples where one organization's Power BI reports have very different styles that detract from usability. It's common for many Power BI report developers to work on one project, and we recommend a review of correct processes on all reports, so they meet the standards described previously.
Security and access
Plan which users or roles need access to which reports. Understand the sensitivity of your data and who should see what data. You have granularity of access to reports and data with Power BI, with two main security methods:
Workspaces and apps where reports reside in folders and users are granted access to the folders. To clarify, reports are saved to workspaces, then published to apps.
Row-level security, where data is filtered according to the user. All users see the same report, but different data. We often deploy this where organizations are broken down into operating companies or subsidiaries, and each subsidiary has its own finance manager who needs to see the company they are responsible for. Row-level security allows you to deploy a single report where each finance manager just sees the organizations they are responsible for. This topic is covered in more detail in Chapter 13, Evolving and Maintaining Your Report.
Workspaces/apps and row-level security work together. Therefore, a report will reside in a workspace/app, and users are granted access to the workspace/app. Furthermore, the users may be subject to row-level security that governs the data they view in the workspace/app. It's important to note that row-level security is optional; workspaces are not.
To make user management easier, you can use Microsoft 365 security groups, so you add the security group to the workspace, and the users that belong to the security group will be added. As users are added to and removed from security groups, they will gain and lose access to the workspaces.
Data sources
It's important to list your potential data sources for the project with organizational owners included as project stakeholders (discussed later, in the Identifying your data sources section). Understand what access you need from which system and communicate with the system owners to set expectations about the need to access the data and to understand considerations of accessing the data. To provide an example, some organizations use the payroll capabilities of their ERP application. Payroll records are treated with the highest confidentiality by most organizations, for obvious reasons. So, if the project team needs to access the database tables for finance, should they be able to see payroll data? If the answer is no, user access roles will be required for the team to see finance tables, but not payroll tables.
Another important consideration with data sources is the effect of data refresh on the source application. If the application is hosted on-premise or in a data center with fixed compute resources, Power BI refreshes at scale may degrade application responsiveness to core users. You may want to consider a data warehouse architecture where necessary tables are copied to a separate server overnight or when a few users are using the application, so performance issues are not an issue.
The other major consideration that would drive a Power BI project is the need to consolidate data from multiple different systems; for example, if there is a need to report across a group of companies that use different financial recording systems. In this case, the "standard" reports are effectively negated anyway. While a trial balance is broadly the same across all applications, the specifics of the format will be different, and even the calendars and chart of accounts may vary. In these cases, a further piece of work needs to be considered in the project scoping: how to map between these different datasets. This will be covered in more detail in the chapters looking at how to implement a model, but this is an area that will need engagement from the appropriate subject matter experts within the business.
Stakeholder identification and engagement
Your stakeholders are people involved and impacted by the project. We've provided the following list of some common stakeholders that we see in the projects we serve. The list is role-based, so one individual could fill multiple roles, and we recommend that all roles are considered, even if you initially feel that not all roles are relevant. For example, if you don't have a data security function within your organization, this should be a good reason to assign someone to understand the risk of data leakage and methods to mitigate the risks.
Project sponsor:
For Power BI and finance projects, usually the CFO, but it can also be the CEO
Has the authority to approve budgets, changes, and key project decisions
Project manager:
Responsible for planning, executing, and closing the project
Manages the project team, resources, schedule, and scope
Project team:
Includes all the individuals working to deliver the reports for the project, ensuring they're in line with the standards set in the project scope
The project team can include data architects, report developers, and end users, led by the project manager
IT department:
Many of the Power BI finance projects we work on are led by the finance function, with the IT department as an important stakeholder
Provides technical expertise, support, and provisioning of the technical and licensing infrastructure
End users and data owners:
The individuals or groups who will use the final reports
Provide valuable feedback on functionality, speed, design, and usability
Stakeholders from other departments:
Representatives from departments that will be affected by the project, such as marketing, finance, HR, or operations
They provide input on requirements and ensure the reporting outputs align with departmental needs
Security team:
Ensures that the project adheres to security policies and best practices
Identifies potential security risks and implements measures to mitigate them
It's important to set expectations with stakeholders of their role(s) and purpose early in the project. We also recommend that stakeholders have time allocated to execute project tasks, such as testing reports, so the project isn't held back by stakeholders being "too busy."
Risk management
Identify potential risks early and develop mitigation strategies. Include a risk management plan in the project scope. Common risks during a Power BI project are as follows:
Resource availability with competing business priorities. Hearing that something hasn't been done because something else more important came up is common. You'll need a plan to avoid this from the start.
The technical risk of getting information from diverse systems is frequently an issue. We recommend a proof of concept for all aspects to understand where issues are likely to arise.
Scope creep (despite this exercise) is a factor with all projects and should be listed.
The risk management plan should be revisited on a frequent basis to monitor mitigation actions and record new risks as they arise, with their own mitigation plans. As with all the project documentation we describe, please consider them live documents that are updated as the project progresses.
Resource planning and time management
Identify the resources (human, financial, technical) required for the project. Ensure resource availability and allocation are planned and signed off. One of the most common challenges for a Power BI project is resource availability, as we've mentioned previously.
Develop a project timeline with realistic deadlines. We generally deliver based on an agile methodology through project sprints where the work is divided into one- or two-week (generally two) sprints. At the end of each sprint, completed work is reviewed, and the project is course-corrected for the next sprint as lessons are learned. The benefit of this method is quick and frequent delivery of reports and report updates. For most finance organizations, a pure agile methodology is not required, and we recommend a mix of project planning methods to help set expectations for budget and timeframes.
Agile versus waterfall methodology, and sprints
Waterfall methodologies are generally the more "traditional" project methodologies – in a waterfall methodology, all aspects of the project are built, tested, and then released to the users all in one go.
Agile methodologies, by contrast, break the work up into smaller parcels that can be released piece by piece over a period of time. Using such methods, it is possible to release elements of a project much earlier and start gaining a return on investment much sooner.
Sprints are the basic unit of work that an agile project is broken into. Typically, they consist of 2-week periods at the end of which there is normally a release of the work done within that sprint.
Using a hybrid methodology, you'll plan the overall delivery timeframe and phases using a waterfall methodology. This will help you understand the overall timeframes of the project and allow you to plan when resources will be required for certain phases. Testing and training are good examples where you'll need certain people within the organization to plan time to be available.
In execution, you can get the best of the Agile methodology through sprints by having daily standups, feedback through retrospective meetings, and incremental releases that keep the desire for continual delivery satiated.
Change control process
Establish a change control process to handle scope changes. Your scope will change throughout your project, and this should be expected and managed. We've seen too many instances of users directly asking developers for changes without consideration of how the change affects the overall scope or conflicts with other requirements. Change requests need to be submitted to the project team and signed off on a frequent basis to allow developers to maintain their workflow.
Change control should include the following as a minimum:
A request form completed to log the change request. This can be a Power App, a SharePoint list, or a DevOps or Jira case.
A method of dealing with change requests. This can be an individual or a change control board that meets frequently to discuss and accept/decline change requests.
Adding the accepted change request to the schedule of work or sprints to assess the impact on the project.
The incorporation of agreed changes into the test plan.
Remember that all changes have an impact on the timeframe and cost of the project. These can be positive and negative, as change sometimes means cutting functionality that isn't required.
Test plan
Testing is an essential part of a Power BI project to help you deliver quality reports, so we've devoted Chapter 10, Testing and Fine-Tuning Your Data, to this subject. This section briefly describes how to incorporate testing into your project scope.
Testing has two interesting distinctions in Power BI projects. The first is that most users think it's optional, and the second is that most users expect the developers to deliver perfect, accurate reports.
Here's some friendly advice, italicized for dramatic impact:
Testing your reports is a business task. Do not expect your developers to do it.
For the purposes of the scoping document, each report needs to have at least one tester assigned to the report who will sign it off as being correct. If it's not correct, they will work with the developer until the report is correct. You'll need definitions of what is being tested and signed off on, with functional aspects:
Accuracy of data
Working slicers
Speed
There are also non-functional aspects:
Adherence to design guidelines
Correct use of color
Neatness of layout
Accessibility
We recommend building a checklist that can be used as a guide for the testers to check off as they test and record any issues.
Training plan
As Power BI has capabilities that most people in your organization won't have experienced, comprehensive training is essential for users to understand the new tool and to get the best from it.
In our training, we seek to conceptualize how Power BI is different from standard application reports in terms of functionality and how you can interact with data. We also train users on the flexibility of Power BI and how measures can easily be added to help understand and analyze data. If users are exporting Power BI data to Excel, you have a training problem.
For the purposes of the project scope, the training plan should identify the purpose of the training, who will deliver it, and the users who will be trained. We segment users, described in the section – Who needs to use your reports?
Think about users in two ways:
Where they sit functionally in the organization. Finance is obvious, but you'll also have many users of financial reports outside of the finance function, such as operations, management, or purchasing.
Their skill level or desired skill level with Power BI. The majority of your users will be consumers of the Power BI data. Some will want to create reports based on validated data models, and a subset may even have the skills to become developers. All these groups will need a different level of training.
The training plan needs to reflect your potential users in both functional and skill requirements. You'll also need to plan to train users over time who join and move within your organization, so make sure you plan for repeatability of the material.
Communication plan
Develop a communications plan that articulates the who, what, frequency, and channel.
Who will be your project team, project stakeholders, and the wider organization, as many people will interact with Power BI at some point, even if it's presented at a meeting?
What is the purpose of communication? Projects generate lots of detailed information, so identification of different types of information is essential to decide who needs to see it. For example, users probably don't need to see how many change requests have been generated in a week, but will want to understand functional changes that will affect them.
What is the frequency of communication? We recommend communicating at set times/days of the week or month so recipients of the communications know what to expect and when to expect it.
The communications channel is also important. We have many options within organizations, such as Teams and Slack, and most of them allow @mentions. People still use email, although we don't recommend spamming people with project updates, as they won't get read. Use whatever works in your organization so people can easily find the information when required. Plan to be clear and concise with your communications and follow a standard format.
Documentation and sign-off
Document all aspects of the project scope and obtain sign-off from key stakeholders. This ensures alignment and commitment.
The project scope is a living document. As changes happen to the project, the scope needs to be updated to document the changes. We recommend storing the document somewhere that everyone required can see it, but only a few people can change it. Like any document that changes frequently, don't distribute it by email, as you'll encounter versioning issues with many people working on outdated versions on their hard drives or email inboxes.
Depending on the size and complexity of your project, you may choose to skip some of this list. Conversely, you may need to expand certain aspects to suit specific circumstances. Having to make some architectural changes, such as implementing a data warehouse, may necessitate a section on the implications of this architectural requirement. Whatever you choose to exclude, include, or expand upon, we strongly recommend a good scope as the guide for the rest of the project.
You may not need everything in the requirements of project scoping that we've described here, but we ask that you consider everything. Power BI projects are complex, with many moving parts. The purpose of a detailed project scope and plan is to help you navigate the occasional bump in the road, as they will occur. Thorough planning rarely has downsides, especially if there are issues and you can quickly deal with them. And if everything goes to plan, you just did your job well.
Read this chapter and the full book FREE of cost - No Credit card required!
Plus access over 8,000 other expert tech books and videos just by signing up - No commitment!
CONTINUE READING
83
Tech Concepts
36
Programming languages
73
Tech Tools
Unlimited access to the largest independent learning library in tech of over 8,000 expert-authored tech books and videos.
Innovative learning tools, including AI book assistants, code context explainers, and text-to-speech.
50+ new titles added per month and exclusive early access to books as they are being written.


 Free Chapter